
- Home >
- Free Stock Photos & Images >
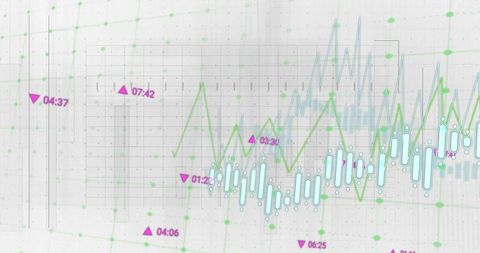
- Dynamic Data Visualization Dashboard with Notifications and Alerts
Dynamic Data Visualization Dashboard with Notifications and Alerts Free Stock Image

Image depicts a data analytics dashboard featuring a navy grid backdrop with a zigzag blue line. Various pop-up labels like 'Message Sent', 'Video Playing', and 'Get Notified' are overlaying the chart. This visualization is indicative of a data-driven user interface that monitors performance metrics and notifies users of specific activities. Ideal for presentations, digital reports, and technology-focused projects emphasizing data flow, performance tracking, and interactive design solutions.
Powered by  - Get 15% off with code: PIKWIZARD15


downloads
Tags:
More
Credit Photo
If you would like to credit the Photo, here are some ways you can do so
Text Link
photo Link
<span class="text-link">
<span>
<a target="_blank" href=https://pikwizard.com/photo/dynamic-data-visualization-dashboard-with-notifications-and-alerts/faa119cc85cee2fc91f0140867dedcaf/>PikWizard</a>
</span>
</span>
<span class="image-link">
<span
style="margin: 0 0 20px 0; display: inline-block; vertical-align: middle; width: 100%;"
>
<a
target="_blank"
href="https://pikwizard.com/photo/dynamic-data-visualization-dashboard-with-notifications-and-alerts/faa119cc85cee2fc91f0140867dedcaf/"
style="text-decoration: none; font-size: 10px; margin: 0;"
>
<img src="https://thumbs.wbm.im/pw/medium/faa119cc85cee2fc91f0140867dedcaf.jpg" style="margin: 0; width: 100%;" alt="Dynamic Data Visualization Dashboard with Notifications and Alerts" />
<p style="font-size: 12px; margin: 0;">PikWizard</p>
</a>
</span>
</span>
Free (free of charge)
Free for personal and commercial use.
Author: People Creations
Similar Free Stock Images


Premium


Premium


Premium


Premium


Premium


Premium


Premium


Premium


Premium


Premium


Premium


Premium


Premium


Premium


Premium


Premium


Premium


Premium


Premium


Premium


Premium


Premium


Premium


Premium


Premium

Explore More Free Stock Images