- Home >
- Stock Photos >
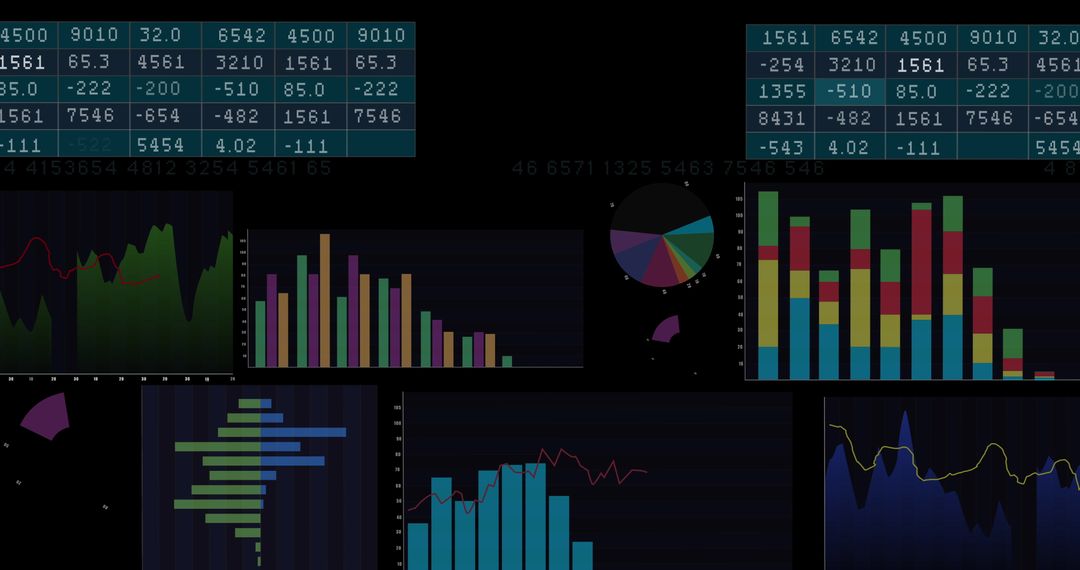
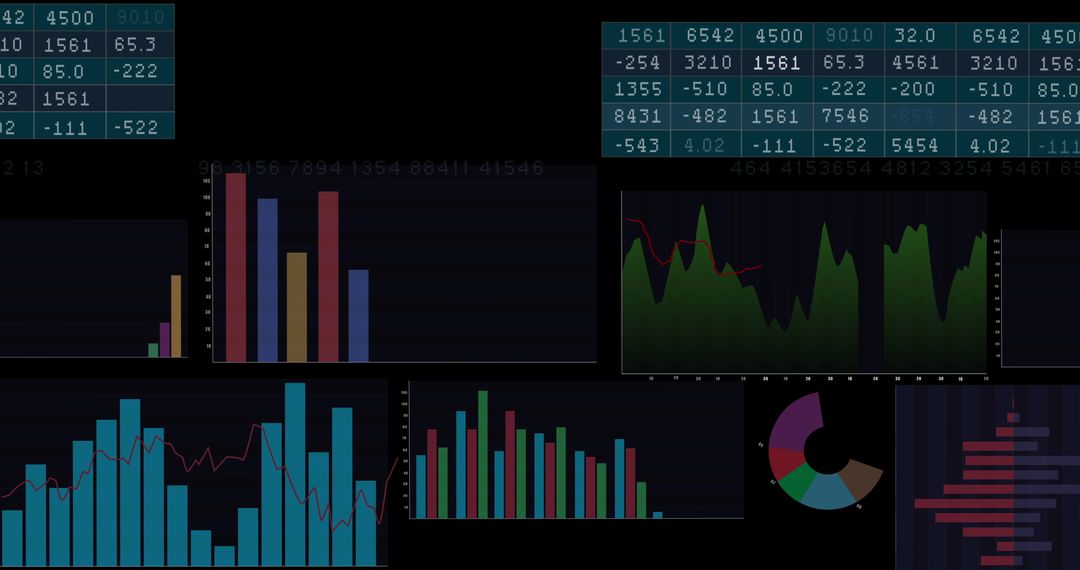
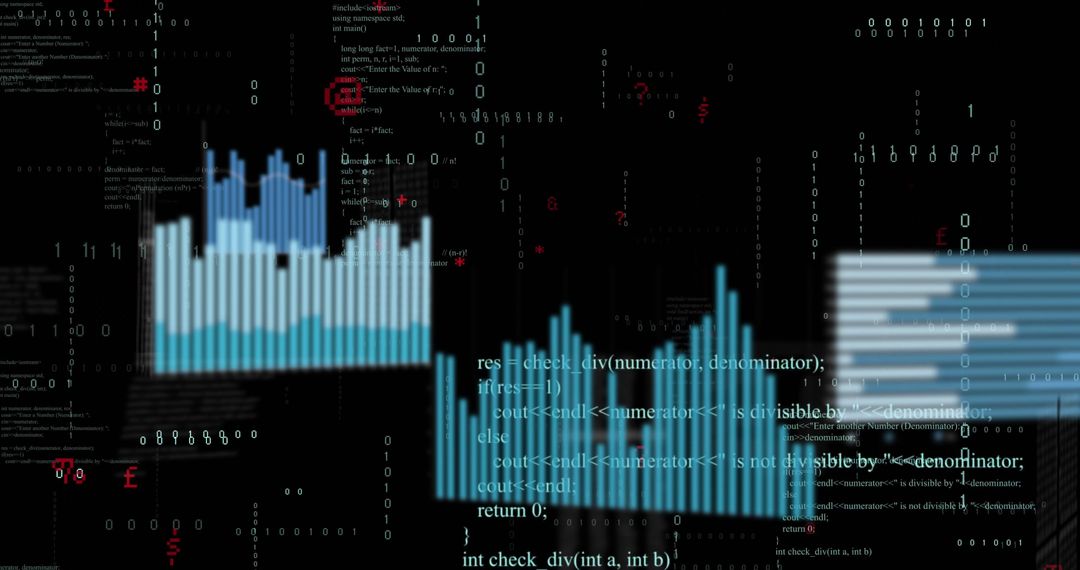
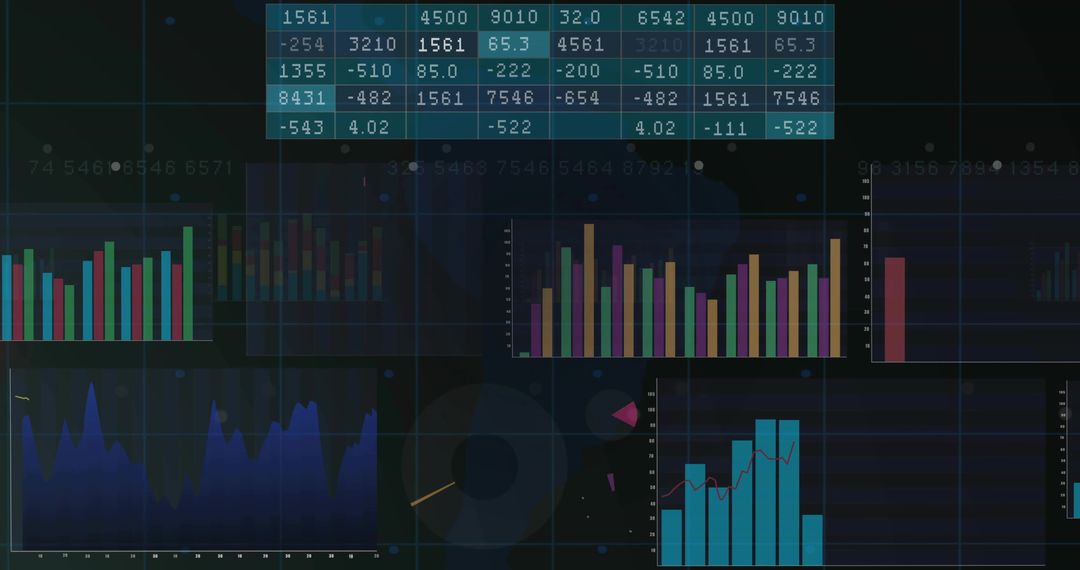
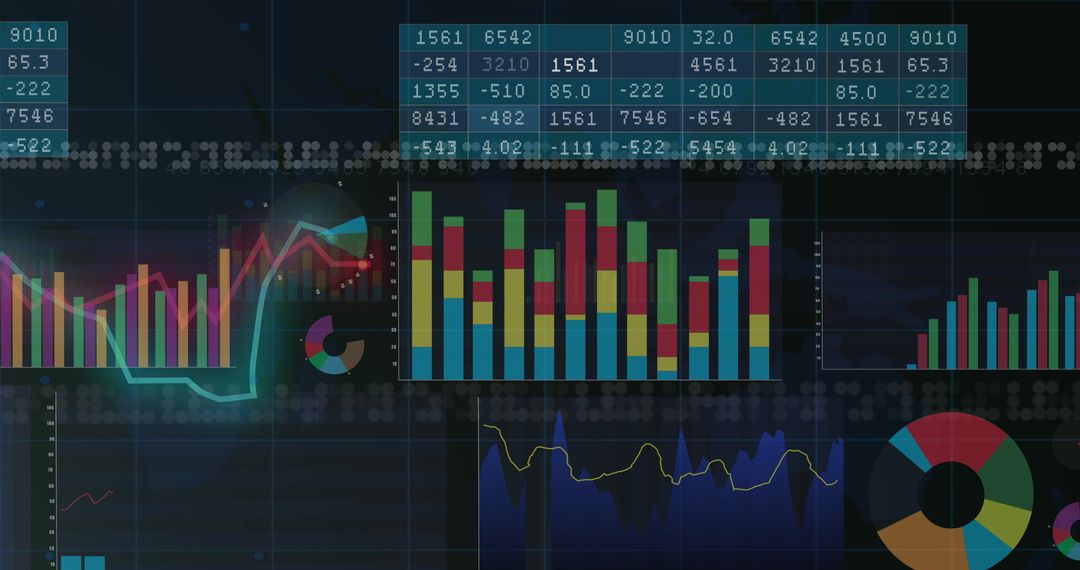
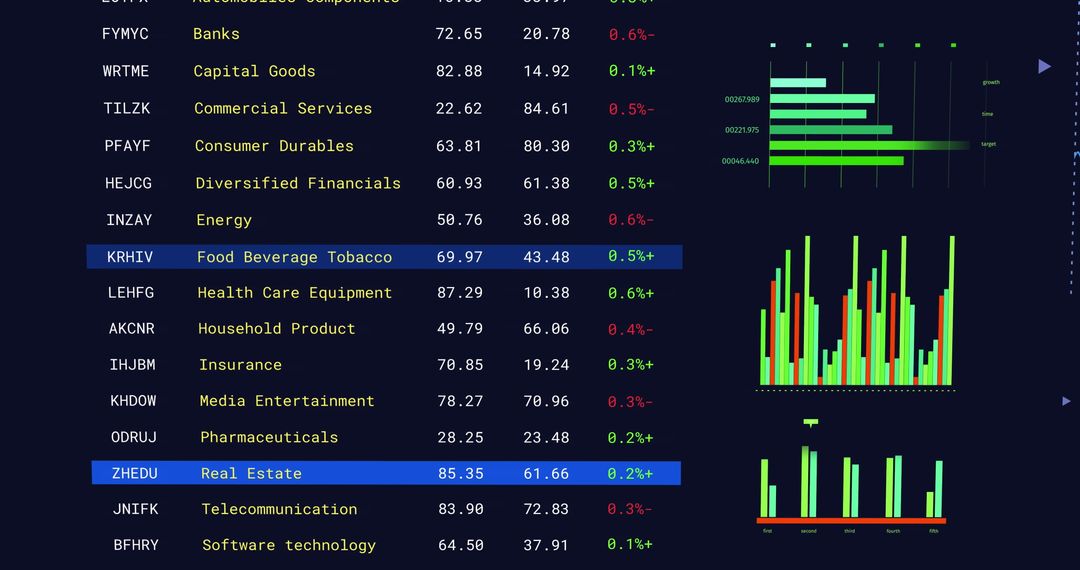
- Dynamic Data Visualization Depicting Financial Growth Trends
Dynamic Data Visualization Depicting Financial Growth Trends Image

This image showcases a sophisticated blend of data visualizations, featuring bar graphs, pie charts, and numeral data over a black background. It serves as an ideal visual for discussing topics related to digital analytics in financial services, stock market analysis, and global economic trends. Suitable for use in presentations, fintech articles, and reports focused on digital business strategies or the growing technology sector.
Powered by  - Get 15% off with code: PIKWIZARD15


4
downloads
downloads
Tags:
More
Credit Photo
If you would like to credit the Photo, here are some ways you can do so
Text Link
photo Link
<span class="text-link">
<span>
<a target="_blank" href=https://pikwizard.com/photo/dynamic-data-visualization-depicting-financial-growth-trends/e47c352489306b5e88ab14eacbc9b4aa/>PikWizard</a>
</span>
</span>
<span class="image-link">
<span
style="margin: 0 0 20px 0; display: inline-block; vertical-align: middle; width: 100%;"
>
<a
target="_blank"
href="https://pikwizard.com/photo/dynamic-data-visualization-depicting-financial-growth-trends/e47c352489306b5e88ab14eacbc9b4aa/"
style="text-decoration: none; font-size: 10px; margin: 0;"
>
<img src="https://pikwizard.com/pw/medium/e47c352489306b5e88ab14eacbc9b4aa.jpg" style="margin: 0; width: 100%;" alt="" />
<p style="font-size: 12px; margin: 0;">PikWizard</p>
</a>
</span>
</span>
Free (free of charge)
Free for personal and commercial use.
Author: Authentic Images
Similar Free Stock Images
Premium


Premium


Premium


Premium


Premium


Premium


Premium


Premium


Premium


Premium


Premium


Premium


Premium


Premium


Premium


Premium


Premium


Premium


Premium


Premium


Premium


Premium


Premium


Premium