- Home >
- Stock Photos >
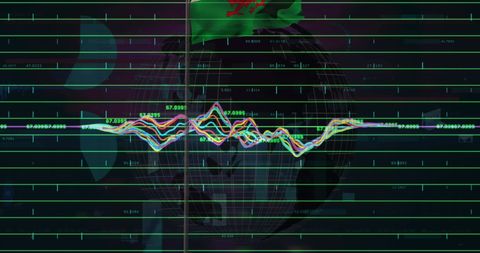
- Dynamic Data Visualization Displaying Interactive Waveforms
Dynamic Data Visualization Displaying Interactive Waveforms Image

Illustration depicts multicolored waveform analytics on modern technology interface with green grid patterns. Featured UI elements such as a like counter and comment bubbles indicate interactive functionality. Useful for conveying digital transformation concepts, user interface design, network technology, and innovative data presentation strategies in tech-based marketing or educational content.

downloads
Tags:
More
Credit Photo
If you would like to credit the Photo, here are some ways you can do so
Text Link
photo Link
<span class="text-link">
<span>
<a target="_blank" href=https://pikwizard.com/photo/dynamic-data-visualization-displaying-interactive-waveforms/e8186d44df8694e9fb33ed0b068d0b88/>PikWizard</a>
</span>
</span>
<span class="image-link">
<span
style="margin: 0 0 20px 0; display: inline-block; vertical-align: middle; width: 100%;"
>
<a
target="_blank"
href="https://pikwizard.com/photo/dynamic-data-visualization-displaying-interactive-waveforms/e8186d44df8694e9fb33ed0b068d0b88/"
style="text-decoration: none; font-size: 10px; margin: 0;"
>
<img src="https://pikwizard.com/pw/medium/e8186d44df8694e9fb33ed0b068d0b88.jpg" style="margin: 0; width: 100%;" alt="" />
<p style="font-size: 12px; margin: 0;">PikWizard</p>
</a>
</span>
</span>
Free (free of charge)
Free for personal and commercial use.
Author: People Creations