- Home >
- Stock Photos >
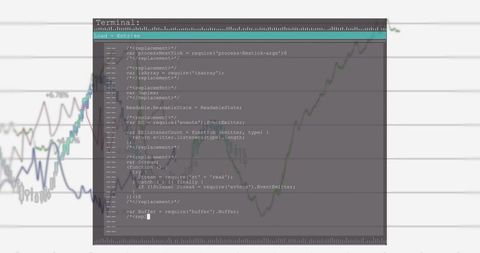
- Dynamic Data Visualization in Abstract Digital Interface
Dynamic Data Visualization in Abstract Digital Interface Image

Visually represents dynamic data visualization within an abstract digital interface. This concept highlights the intersection of technology and data analytics, showcasing fragments of coding and algorithms. Suitable for articles, presentations, or websites discussing data processing, digital interfaces, and future-tech innovations.

downloads
Tags:
More
Credit Photo
If you would like to credit the Photo, here are some ways you can do so
Text Link
photo Link
<span class="text-link">
<span>
<a target="_blank" href=https://pikwizard.com/photo/dynamic-data-visualization-in-abstract-digital-interface/b3887047d4a195884a4a38a99a9e90d4/>PikWizard</a>
</span>
</span>
<span class="image-link">
<span
style="margin: 0 0 20px 0; display: inline-block; vertical-align: middle; width: 100%;"
>
<a
target="_blank"
href="https://pikwizard.com/photo/dynamic-data-visualization-in-abstract-digital-interface/b3887047d4a195884a4a38a99a9e90d4/"
style="text-decoration: none; font-size: 10px; margin: 0;"
>
<img src="https://pikwizard.com/pw/medium/b3887047d4a195884a4a38a99a9e90d4.jpg" style="margin: 0; width: 100%;" alt="" />
<p style="font-size: 12px; margin: 0;">PikWizard</p>
</a>
</span>
</span>
Free (free of charge)
Free for personal and commercial use.
Author: Creative Art