
- Home >
- Stock Photos >
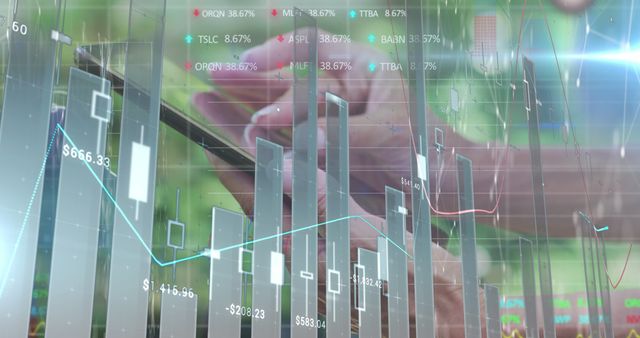
- Dynamic Data Visualization in Global Finance and Technology
Dynamic Data Visualization in Global Finance and Technology Image
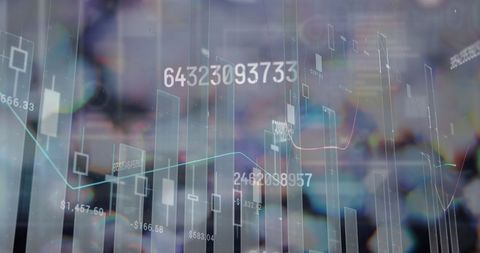
This illustration highlights the interplay of numbers and statistical data within global finance and technology landscapes. Ideal for articles on digital transformation in finance, forecasts, market analyses, financial reports, and technical investment strategies. Perfect for use in technology and finance blogs, presentations on stock market trends, or educational materials around statistical modeling.
Powered by 


downloads
Tags:
More
Credit Photo
If you would like to credit the Photo, here are some ways you can do so
Text Link
photo Link
<span class="text-link">
<span>
<a target="_blank" href=https://pikwizard.com/photo/dynamic-data-visualization-in-global-finance-and-technology/9729fcee77337885f6ea9c0e71066af3/>PikWizard</a>
</span>
</span>
<span class="image-link">
<span
style="margin: 0 0 20px 0; display: inline-block; vertical-align: middle; width: 100%;"
>
<a
target="_blank"
href="https://pikwizard.com/photo/dynamic-data-visualization-in-global-finance-and-technology/9729fcee77337885f6ea9c0e71066af3/"
style="text-decoration: none; font-size: 10px; margin: 0;"
>
<img src="https://pikwizard.com/pw/medium/9729fcee77337885f6ea9c0e71066af3.jpg" style="margin: 0; width: 100%;" alt="" />
<p style="font-size: 12px; margin: 0;">PikWizard</p>
</a>
</span>
</span>
Free (free of charge)
Free for personal and commercial use.
Author: Authentic Images
Similar Free Stock Images

Premium


Premium


Premium

Premium

Premium


Premium


Premium


Premium


Premium

Premium

Premium


Premium


Premium


Premium

Premium


Premium


Premium


Premium


Premium


Premium


Premium


Premium


Premium


Premium


Premium

Explore More Free Stock Images