
- Home >
- Stock Photos >
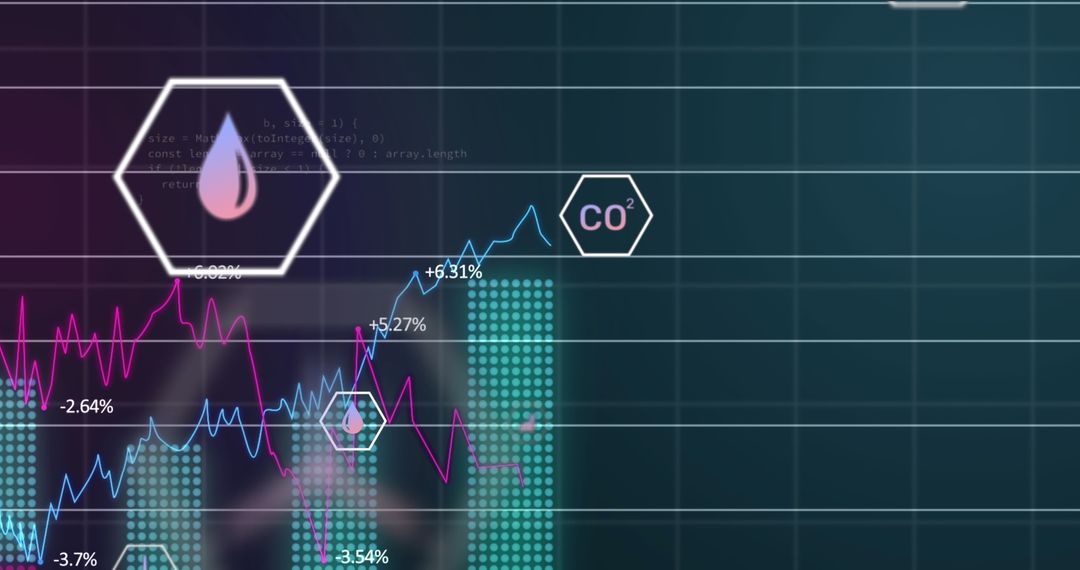
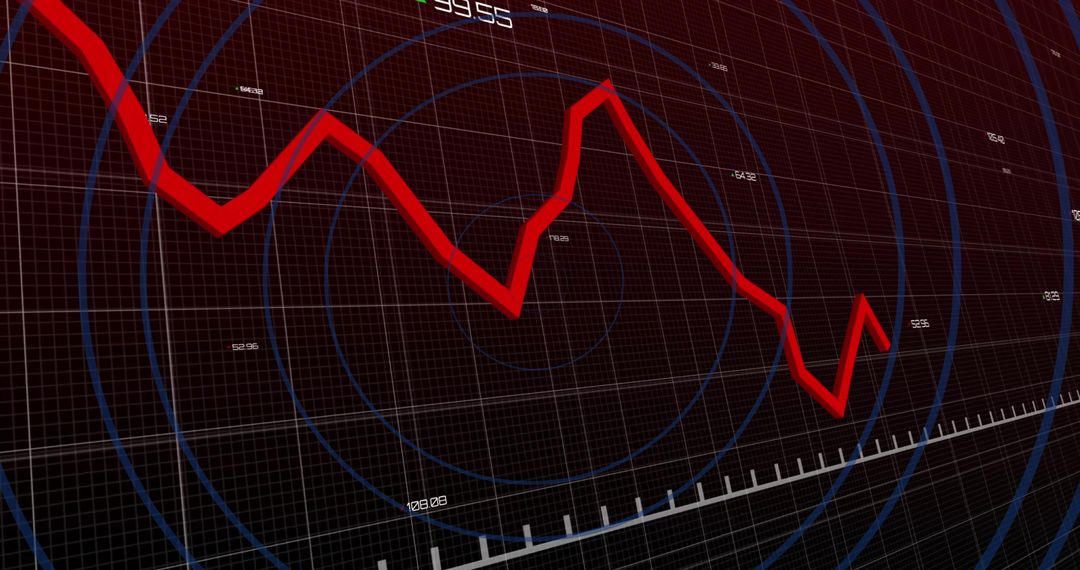
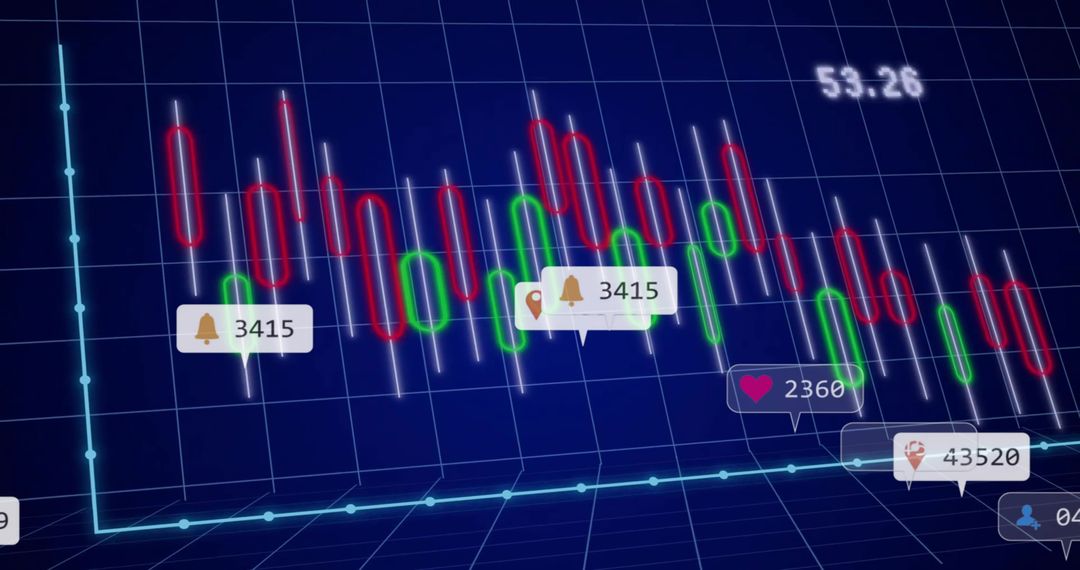
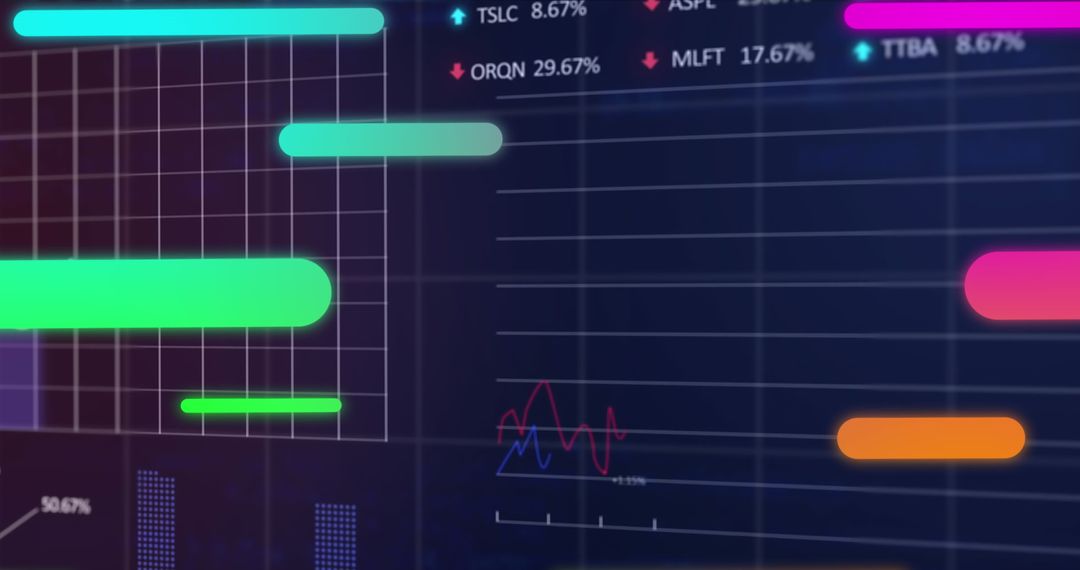
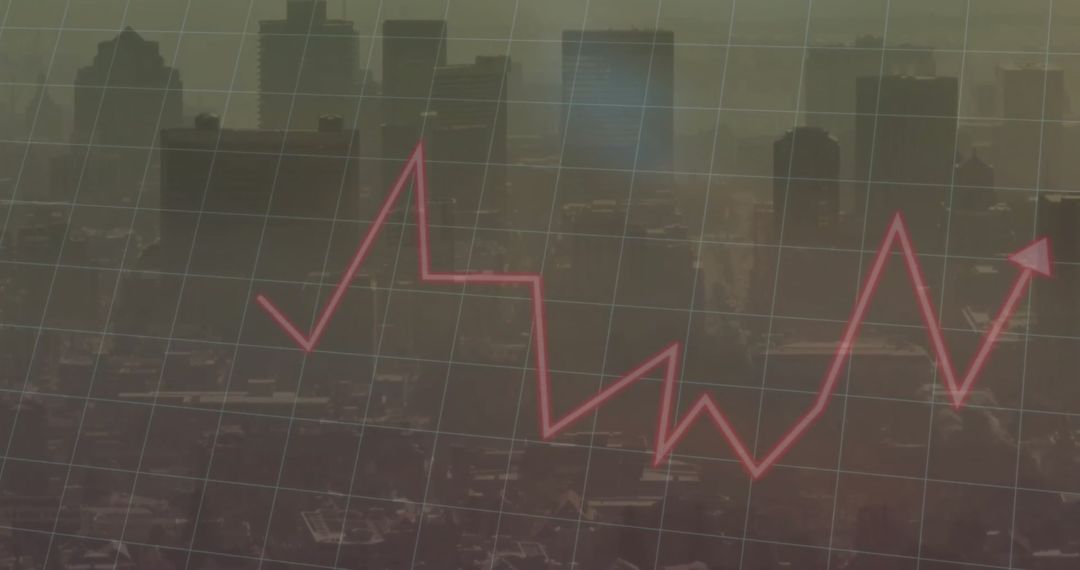
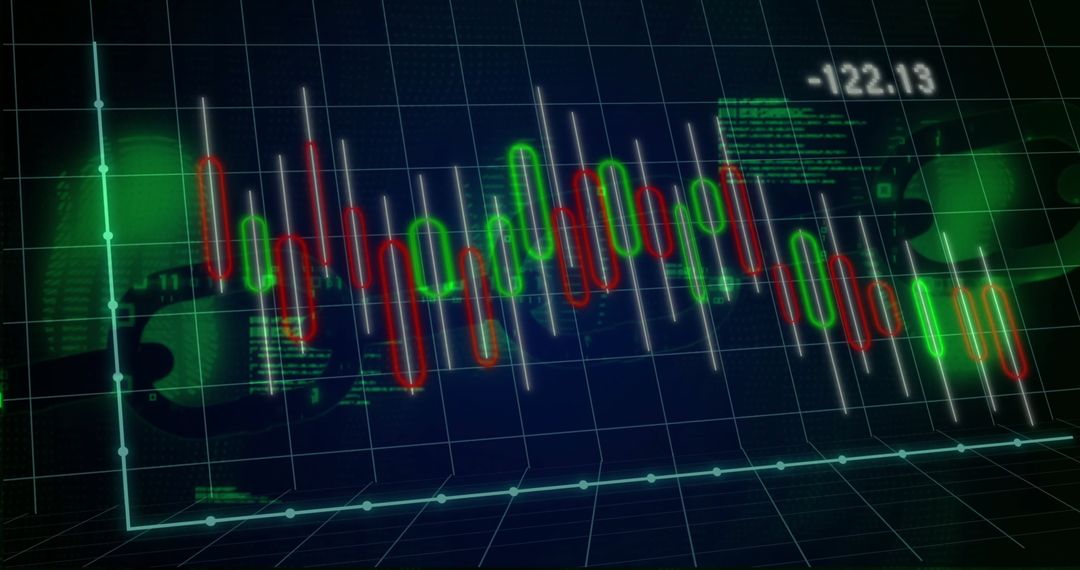
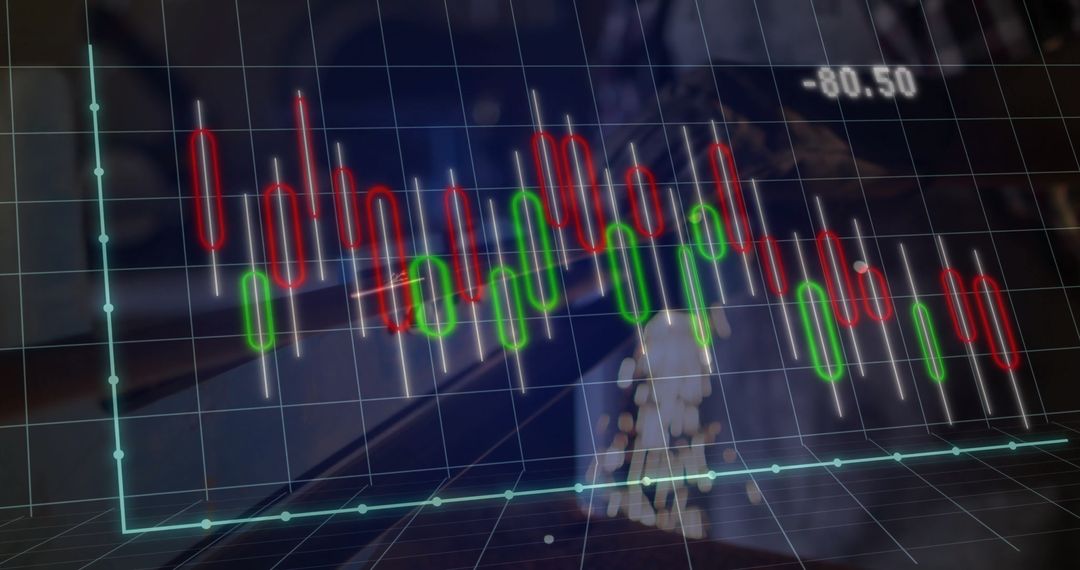
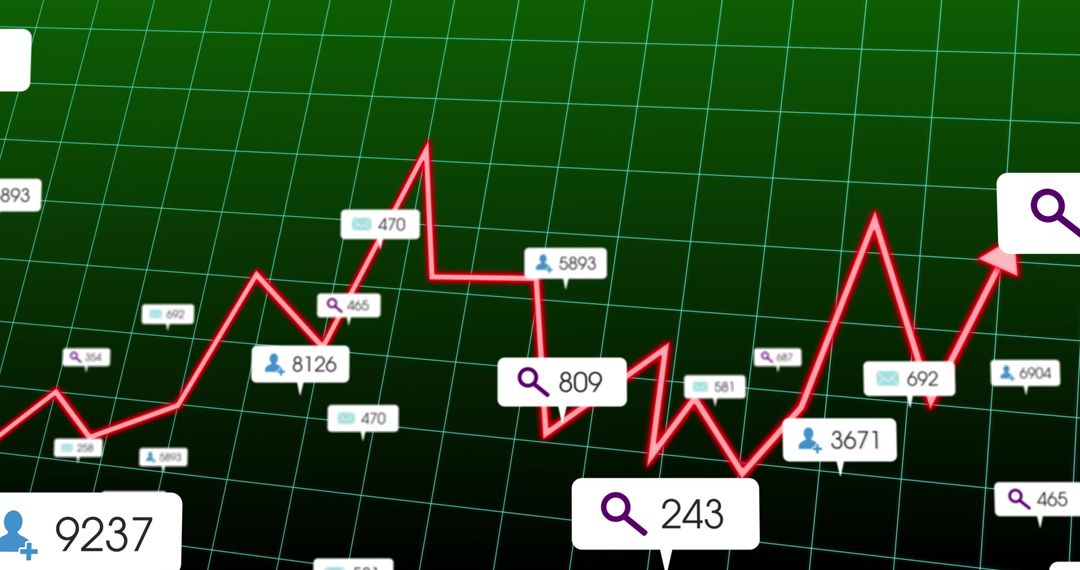
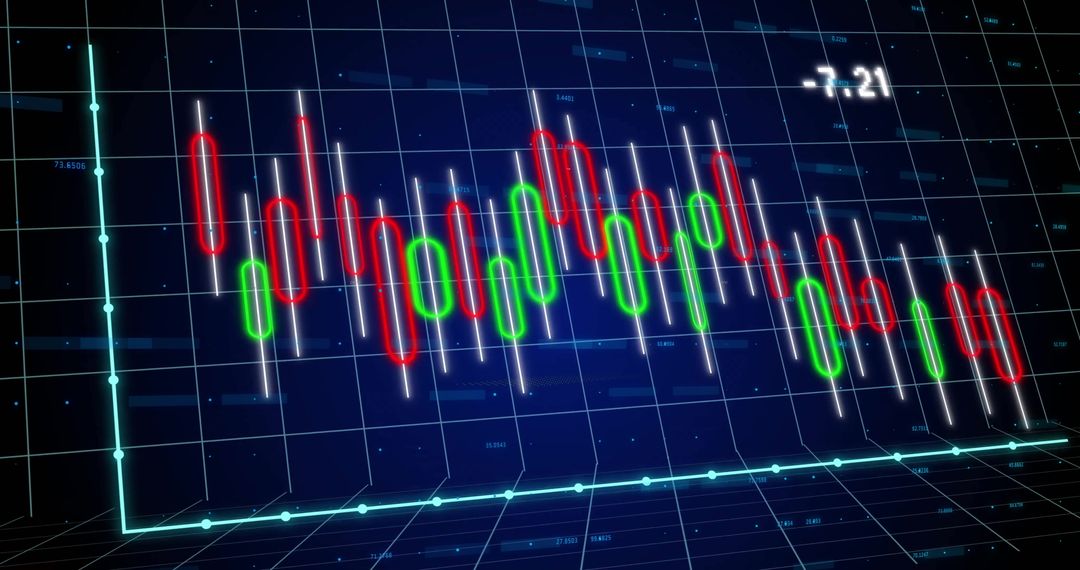
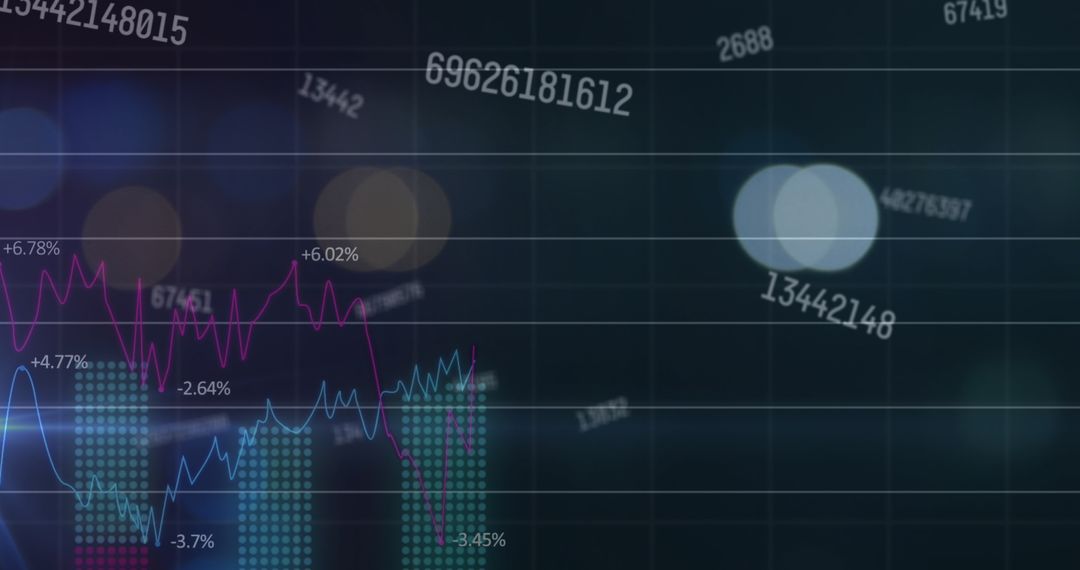
- Dynamic Data Visualization of Financial Chart with Arrow Trends
Dynamic Data Visualization of Financial Chart with Arrow Trends Image

Normal-style chart with digital grid displays fluctuating trend data, visually highlighting metrics movement with colored labels. Useful resource for presentations, technological and financial analytical reports, as well as conveying data analytics principles or financial performance in fintech and educational content.
Powered by  - Get 15% off with code: PIKWIZARD15


0
downloads
downloads
Tags:
More
Credit Photo
If you would like to credit the Photo, here are some ways you can do so
Text Link
photo Link
<span class="text-link">
<span>
<a target="_blank" href=https://pikwizard.com/photo/dynamic-data-visualization-of-financial-chart-with-arrow-trends/f5011fba83923f6cbabde7bb36278194/>PikWizard</a>
</span>
</span>
<span class="image-link">
<span
style="margin: 0 0 20px 0; display: inline-block; vertical-align: middle; width: 100%;"
>
<a
target="_blank"
href="https://pikwizard.com/photo/dynamic-data-visualization-of-financial-chart-with-arrow-trends/f5011fba83923f6cbabde7bb36278194/"
style="text-decoration: none; font-size: 10px; margin: 0;"
>
<img src="https://pikwizard.com/pw/medium/f5011fba83923f6cbabde7bb36278194.jpg" style="margin: 0; width: 100%;" alt="" />
<p style="font-size: 12px; margin: 0;">PikWizard</p>
</a>
</span>
</span>
Free (free of charge)
Free for personal and commercial use.
Author: Creative Art
Similar Free Stock Images

Premium


Premium


Premium


Premium


Premium


Premium


Premium


Premium


Premium


Premium


Premium


Premium


Premium


Premium


Premium


Premium


Premium


Premium


Premium


Premium


Premium


Premium


Premium


Premium

