- Home >
- Stock Photos >
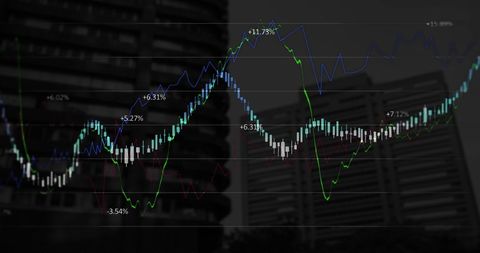
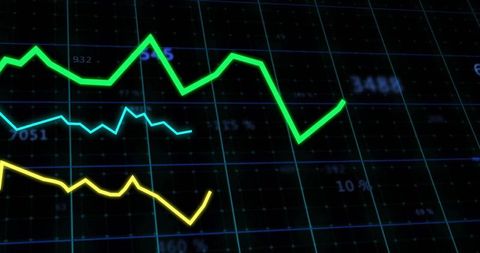
- Dynamic Data Visualization of Financial Graph Trends
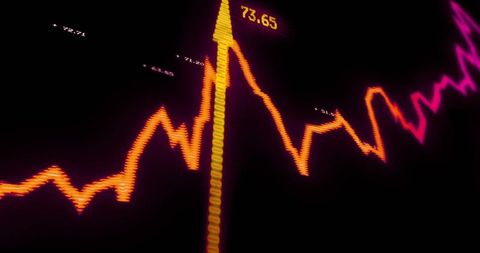
Dynamic Data Visualization of Financial Graph Trends Image
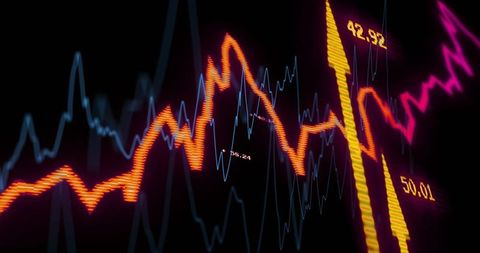
This image showcases vibrant financial graphs, incorporating lines in orange, blue, and magenta against the dark background. Yellow bars and grid lines add depth and precision to the data presentation. The digital design suggests usage in contexts such as financial reports, presentations on stock market trends, and business analysis forums. It is ideal for illustrating concepts in financial technology and sophisticated data visualization trends.

downloads
Tags:
More
Credit Photo
If you would like to credit the Photo, here are some ways you can do so
Text Link
photo Link
<span class="text-link">
<span>
<a target="_blank" href=https://pikwizard.com/photo/dynamic-data-visualization-of-financial-graph-trends/cce70be9ccc1e6247cb3a523e1db3fb8/>PikWizard</a>
</span>
</span>
<span class="image-link">
<span
style="margin: 0 0 20px 0; display: inline-block; vertical-align: middle; width: 100%;"
>
<a
target="_blank"
href="https://pikwizard.com/photo/dynamic-data-visualization-of-financial-graph-trends/cce70be9ccc1e6247cb3a523e1db3fb8/"
style="text-decoration: none; font-size: 10px; margin: 0;"
>
<img src="https://pikwizard.com/pw/medium/cce70be9ccc1e6247cb3a523e1db3fb8.jpg" style="margin: 0; width: 100%;" alt="" />
<p style="font-size: 12px; margin: 0;">PikWizard</p>
</a>
</span>
</span>
Free (free of charge)
Free for personal and commercial use.
Author: Awesome Content