
- Home >
- Stock Photos >
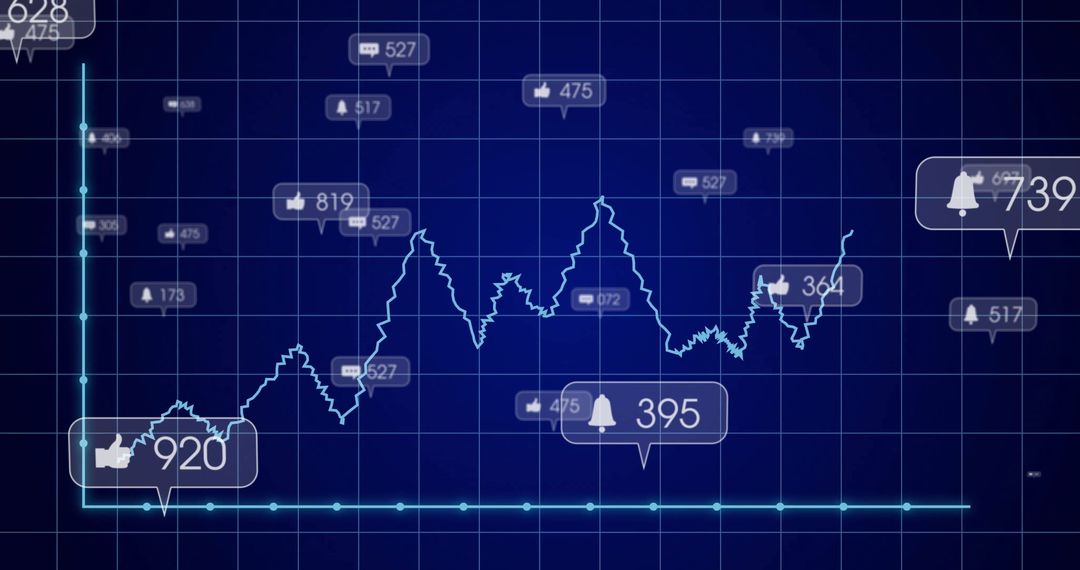
- Dynamic Data Visualization of Social Media Engagement Metrics
Dynamic Data Visualization of Social Media Engagement Metrics Image
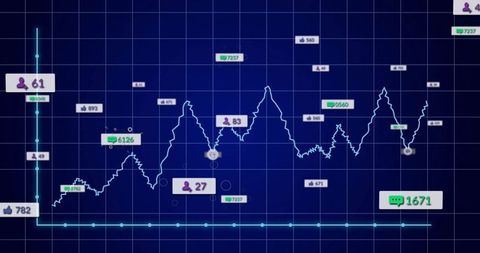
Illustrates a digital analytics dashboard with a fluctuating line graph showing social media engagement metrics. Icons display interactions like users and comments, enhancing analytical understanding. Perfect for showcasing business technology, statistical analysis strategies, or digital marketing presentations. Useful in topics related to data science, tech advancements, or illustrating methods in business growth visualization.
Powered by  - Get 15% off with code: PIKWIZARD15


0
downloads
downloads
Tags:
More
Credit Photo
If you would like to credit the Photo, here are some ways you can do so
Text Link
photo Link
<span class="text-link">
<span>
<a target="_blank" href=https://pikwizard.com/photo/dynamic-data-visualization-of-social-media-engagement-metrics/0e9fde6631a481290ad02cbe68961459/>PikWizard</a>
</span>
</span>
<span class="image-link">
<span
style="margin: 0 0 20px 0; display: inline-block; vertical-align: middle; width: 100%;"
>
<a
target="_blank"
href="https://pikwizard.com/photo/dynamic-data-visualization-of-social-media-engagement-metrics/0e9fde6631a481290ad02cbe68961459/"
style="text-decoration: none; font-size: 10px; margin: 0;"
>
<img src="https://pikwizard.com/pw/medium/0e9fde6631a481290ad02cbe68961459.jpg" style="margin: 0; width: 100%;" alt="" />
<p style="font-size: 12px; margin: 0;">PikWizard</p>
</a>
</span>
</span>
Free (free of charge)
Free for personal and commercial use.
Author: Authentic Images
Similar Free Stock Images

Premium


Premium


Premium


Premium


Premium


Premium


Premium


Premium


Premium


Premium


Premium


Premium


Premium


Premium


Premium


Premium


Premium


Premium


Premium


Premium


Premium


Premium


Premium


Premium

