1. Home > 
  2. Stock Photos > 
  3. Dynamic Data Visualization on Digital Dashboard Display

Dynamic Data Visualization on Digital Dashboard Display Image

Dynamic Data Visualization on Digital Dashboard Display

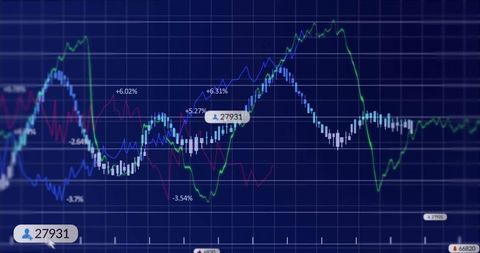
This digital dashboard showcasing an intricate data visualization likely aids in financial analysis and investment tracking. Display of line graphs, bars, and percentage labels represents fluctuations in market or financial data, making it ideal for presentations on business intelligence, accounting classroom material, stock market analysis, or financial strategy planning sessions.

Powered by Shutterstock logo - Get 15% off with code: PIKWIZARD15
A businessman points at a rising digital graph, symbolizing growth and opportunity in finance. This image captures the essence of data analysis and corporate strategy. - Powered by Shutterstock - Get 15% off with code: PIKWIZARD15Conceptual Graph Depicting Opposing Trends in Financial or Business Analytics - Powered by Shutterstock - Get 15% off with code: PIKWIZARD15Displaying trading dashboard on screen with line graphs, bar charts, numeric data and lens flare. Technology, analytics, innovation, finance, data visualization, futuristic, digital - Powered by Shutterstock - Get 15% off with code: PIKWIZARD15Showing line graph 2008–2015 on dashboard with bar charts and histograms, gridlines and labels. Data visualization, analytics, digital interface, financial analysis, business intelligence, - Powered by Shutterstock - Get 15% off with code: PIKWIZARD15Displaying red line graph traversing black grid on data screen with HUD rings and numeric labels. Futuristic, technology, analytics, interface, digital, innovation, progress - Powered by Shutterstock - Get 15% off with code: PIKWIZARD15

Credit Photo

If you would like to credit the Photo, here are some ways you can do so

Free (free of charge)

Free for personal and commercial use.

Author: Creative Art

Similar Free Stock Images

Dynamic Financial Data Analytics and Stock Market Trends
Premium
Dynamic Financial  Stock Market Line Graph Data Visualization. Upward Trend and Growth Chart
Financial Data Chart Over City Silhouette
Global Financial Market Trends on Digital Screen
Premium
Bar and line graphs image over abstract background with glowing elements. Data, analytics, statistics, visualization, business, finance
Digital Financial Chart With Trend Lines and Analytics Display
Interactive Data Visualization Dashboard with Trend Analysis
Digital Data Processing with Technology Interface on Blue Background
Dynamic Financial Data on Dark Background With Colorful Graphs
Premium
Displaying financial chart at digital interface, with blue bars, two line graphs, red decline arrow. Finance, data, analytics, dashboard, technology, investment, digital
Dynamic Data Visualization with Multicolor Line Chart and Metrics
Financial Dashboard with Data Visualization and Social Interaction Metrics
Dynamic Financial Graphs Illustrating Market Trends
Dynamic Financial Data Analysis Concept with Graph Lines and Orange Background
Digital Financial Analysis Interface Over Data Grid
Dynamic Stock Market Graphs with Trends and Data Alerts
Dynamic Financial Data Trends with Fluctuating Graphs and Charts
Rising Stock Market Trends and Chart Analysis
Premium
Displaying financial chart on trading interface, showing bar charts, line graphs, gridlines. Finance, analytics, data, technology, dashboard, visualization, investment
Financial Stock Market Data Analysis on Digital Interface
Analytical Trading Dashboard with Rising Candlestick Charts
Inflation Analytics: Graphic Representation of Stock Market Trends
Financial Analytics Dashboard with Growth Trends and Indicators
Premium
Displaying market data on office monitor showing candlestick chart, line graph, gauge, price labels. Technology, finance, analytics, data visualization, investment, economy, metrics
Financial Data Analysis in Digital Interface with Graphs
Global Financial Data with Economic Trends and Analytics
Futuristic Data Trend Graphs on Digital Interface
Premium
Dashboard showing bar charts and line graph in digital interface, numeric labels and gauge charts. Data visualization, analytics, dashboard, metrics, digital interface, finance, technology
Graph and Chart Display on White Grid Background
Digital Financial Data Analysis on Dark Background
Dynamic Data Visualization Displaying Interactive Waveforms
Financial Data Visualization with Global Network Elements
Digital Financial Data Processing and Analysis Graphics
Financial Data Stock Analysis with Code Overlays
Stock Market Graph and Data Analysis
Data Analytics with Stock Market Chart Display
Financial Graph Showing Indices Trends on Blue Background
Premium
Writing office worker tracking financial data in notebook at desk, with pen and line graph overlay. Productivity, analytics, data visualization, workspace, modern, professional, concentration
Premium
Business executive wearing suit analyzing financial data on laptop in office with chart overlays. Technology, finance, analytics, corporate, digital, data visualization, professional
Premium
Displaying market chart on trading interface, with bars, candlesticks, line graphs and grid overlay. Financial, data, analytics, digital, modern, technology, investment
Financial Data Analysis with Interactive Graphs
Dynamic Financial Graphs Illustrating Business Growth
Global Data Processing with Dynamic Graph Visualization
Premium
Displaying digital chart on trading desk, with candlestick bars, trend lines and numeric data. Finance, technology, analytics, data visualization, investment, stock market, dashboard
DNA and Financial Graph Integration with Data Analytics Theme
Market volatility dashboard with candlestick trends, percentage labels and gold star overlay
FinTech Global Data Chart with Statistical Analysis
Financial Data Analytics on Digital Interface
Premium
Displaying dashboard presenting metrics in office space with bar charts, line graphs and data grid. Technology, data, analytics, business, innovation, visualization, modern
Digital Financial Chart Showing Growth and Dynamic Indicators
Digital Financial Data Analysis on Abstract Blue Background
Dynamic Financial Charts on Global Digital Grid Background
Financial Data Processing with Graphs and Charts Background
Digital Trading Dashboard Showing Financial Data and Market Trends
Financial Data Charts with Network Connections Digital Interface
Rising Sea Levels Impact Financial Trajectories Concept
Dynamic Global Financial Data with Multicolored Graph Lines
Premium
Many charts and graphs reflect the company's concept of data collection and statistical performance in the past year.
Colorful Financial Data Charts on Digital Grid Background
Premium
Displaying green line graph trending on screen with yellow and teal lines, grid overlay, labels. Data analytics, financial analysis, technology, infographic, business intelligence, digital interface,
Dynamic Financial Trading Chart with Candlestick Graphs
Financial Data Visualization with Increasing Graph Trend
Dynamic Stock Market Graphs Showing Fluctuating Trends
Global Economy Visualization with Data Analytics Concept
Premium
Displaying pie segments, candlesticks and line graphs with values on desk, keyboard and calculator. Finance, analytics, technology, investment, data, strategy, digital
Premium
Displaying financial line chart trending on dashboard interface, with teal line, blue line, numbers. Analytics, data visualization, digital interface, graph, technology, investment, finance
Dynamic Stock Market Analysis with Trend Lines
Social Media Engagement on Analytical Dashboard Display
Stock Market Growth Visualization on Candlestick Chart
Financial Analytics Dashboard with Trend Lines and Data Visualization
Digital Trading Analysis with Graphs and Trendlines
Rising Graphs and Interactive Financial Data Analytics Background
Stock Market Analysis with Graphs and Trading Data
Digital Stock Market Data and Financial Charts Interface
Financial Data Analysis with Stock Market Graphs
Digital Stock Market Data and Trends Visualization
Interactive Touchscreen with Neon Graphics and Data Visualization
Global Financial Data and Stock Market Trends on World Map
Premium
Displaying teal dotted bars on left with blue pink line graphs, network mesh with medical icons. Analytics, data visualization, digital interface, healthtech, financial chart, network diagram,
Global Financial Data Processing with Digital Interface Elements
Dynamic Financial Data Analytics with Stock Market Trends
Dynamic Financial Stock Market Analysis Display
Displaying financial market trends with blue and red line charts, dotted histogram columns and perce
Premium
Colorful financial charts and line graphs overlay a bright office background, symbolizing market analysis, economic growth, and investment trends
Premium
Overlaying financial line graph on wooden desk, with succulent plant and closed laptop. Financial, data, chart, analytics, modern, workspace, technology
Descending Financial Graph on Global Grid Background
Dynamic Digital Display of Financial Data
Analytics Dashboard with Dynamic Financial Graphs and Data
Digital Financial Chart with Line plots and Bar Columns
Digital Security with Data Visualization Elements
Abstract Digital Data Charts Illustrating Market Trends
Stock Market Analysis and Data Processing Graphic
Dynamic Digital Stock Market Chart with Growing Financial Trends
Premium
Displaying bar chart with overlaying line graph on gridded dashboard, with engine background. Finance, data analysis, visualization, technology, automotive, digital, statistics
Graph Showing Stock Market Activity and Financial Data Analysis
Dynamic Global Financial Analytics with Rising Graph Visualization
Digital Financial Graphs and Data Analysis Visualization
Dynamic Stock Market Analysis Concept Artwork
Dynamic Financial Data Analysis with Virtual Screen
Financial Chart with Dynamic Data on Black Grid
Futuristic Financial Dashboard with Dynamic Stock Market Graphs
Financial Graphs and Digital Data on Dark Background
Dynamic Financial Data Graphs Networking in Global Business
Glowing Stock Market Financial Chart Data Overlay
Global finance dashboard displaying live market data, candlestick charts, analytics trends
Premium
Many charts and graphs reflect the company's concept of data collection and statistical performance in the past year.
Dynamic Financial Data Dashboard with Graphs and Currency Indicators
Premium
Many charts and graphs reflect the company's concept of data collection and statistical performance in the past year.
Premium
Writing analyst tracing red line graph across notebook on desk, with pen smartphone grid overlay. Data, analysis, productivity, accuracy, innovation, focus, technology
Digital Data Analysis and Global Financial Market Indicators
Financial Data Analysis with Graphs and Charts on Dark Background
Digital Finance Art with Graphs and Currency Symbols Overlapping
Digital Candlestick Chart with Percentages and Analytics Lines
Premium
Animating financial chart over facade grid on financial dashboard, showing bars and line graphs. Technology, data visualization, corporate, futuristic, digital interface, investment, analytics
Dynamic Time-Series Data Visualization on Digital Dashboard
Modern Multi-Line Chart on Digital Display with Candlesticks
Digital Data Analytics with Financial Graphs and Indigo Background
Neon Circle Highlights Bullish Trend on Digital Dashboard
Premium
Corporate business line graph report
Social Media Alerts Catalysts of Financial Analytics Trends
Futuristic Financial Data Analysis with Graphs and Charts
Fluctuating Red Line on Digital Analytics Dashboard
NFT Trading Analytics Dashboard with Graphs and Data Metrics
Premium
Close-up view of graphs look in the glasses, Many charts and graphs reflect the company's concept of data collection and statistical performance in the past year.
Dynamic Financial Analytic Dashboard with Stock Candlestick Charts
Explore More Free Stock Images