1. Home > 
  2. Stock Photos > 
  3. Dynamic Data Visualization on Modern Digital Dashboard

Dynamic Data Visualization on Modern Digital Dashboard Image

Dynamic Data Visualization on Modern Digital Dashboard

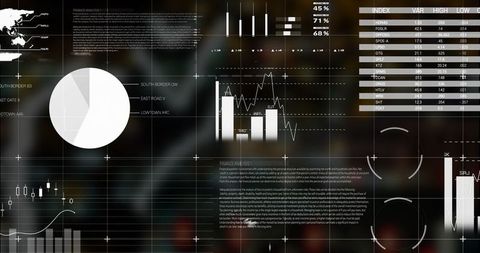
Innovative digital dashboard showcasing pie charts, bar graphs, and percentages, emphasizing high-tech data analysis and efficient information processing. This visual can illustrate concepts in business intelligence, highlight technology innovations, or serve as a backdrop for seminar presentations related to data analytics and modern management strategies.

Powered by Shutterstock logo - Get 15% off with code: PIKWIZARD15
Professional data analyst using data visualizations dashboard on computer monitor for data business analysis and Data Management System - Powered by Shutterstock - Get 15% off with code: PIKWIZARD15Data analytics and insights powered by big data and AI technologies. Data scientist analysing complex information with artificial intelligence for business analytics dashboard with charts and metrics. - Powered by Shutterstock - Get 15% off with code: PIKWIZARD15Analyst working with Business, Concept digital transformation technology strategy, Analytics and Data Management System on computer, make a report with KPI and metrics connected to database. - Powered by Shutterstock - Get 15% off with code: PIKWIZARD15Dashboard finance management on laptop computer analyzing sales data and growth graph chart report. Business planning, strategy and development. Financial accounting. market research, data analysis - Powered by Shutterstock - Get 15% off with code: PIKWIZARD15Businessman using laptop computer analyzing sales data and financial growth graph chart report. Business planning, strategy and development. Financial accounting. market research, data analysis - Powered by Shutterstock - Get 15% off with code: PIKWIZARD15

Credit Photo

If you would like to credit the Photo, here are some ways you can do so

Free (free of charge)

Free for personal and commercial use.

Author: Authentic Images

Similar Free Stock Images

Digital Data Processing with Global Connectivity Elements
Premium
Business data visualization dashboard analytic on laptop screen business data scientist with ai analysis and bar, donut, pie chart data summarise management digital market statistic summary analytics
Global Data Analysis with Mathematical Visualization
Futuristic Digital Analytics Over 3D Cityscape Background
Envelope Icon on Transparent Financial Data Interface
Digital Data Flow and Virtual Interface Visualization
Premium
Man look at the dashboard with graphs and charts. Concept of data management system, business intelligence, data statistics, marketing analysis, key performance indicators (KPI) and analytics.
Holographic Financial Analysis Display with Graphs and Data
Warehouse Data Analysis in Logistics Technology Visualization
Futuristic Digital Data Graphs with Office Building Background
Digital Financial Data Interface with Graphs and Charts
Premium
Man look at the dashboard with graphs and charts. Concept of data management system, business intelligence, data statistics, marketing analysis, key performance indicators (KPI) and analytics.
Global Data Networks Digital Interface with Trend Analytics
Virtual Digital Interface with Video Call and Statistics Overlay
6G Technology Futuristic Digitial Interface Overlay Traffic Background
Cloud Computing Concept with Data Interfaces and Cityscape
Premium
Analysts use computers to analyze statistical data to improve targeted digital online marketing strategies for a business advantage. Data Science Software Developer.
Digital Thank You over Data Processing Interface Background
Floating Virus Cells Over Futuristic Digital Interface
Social Media Notifications on Light Blue Background
Digital Interface with Connected Media Icons
Premium
A businessman uses a laptop to access an AI-powered business analytics dashboard, showcasing charts, metrics, and KPIs. He analyzes performance data to generate. Data analysis concept.
Digital Interface with Business Analytics in Conference Room
Futuristic AR Car Interface with Holographic Elements
Innovative Tech Interface Featuring World Map and Data Visualization
Futuristic Abstract Data Dashboard with Circuit Elements
Premium
Professional Using AI-Powered Laptop and Smartphone to Analyze Data Insights and Marketing Analytics with Holographic Graphs and Infographics, Showcasing Advanced Technology and Future Digital
Digital App Display of Social Media Notifications and Technology Interface
Infographic Over City Skyline with Futuristic Data Visual
Futuristic Data Visualizations over Purple Cloud Background
Futuristic Night Traffic Data Visualization with Pie Charts and World Map
Global Data Visualization with Technology Interface
Digital Currency Market with Floating Credit Cards
Premium
Analyzing Key Performance Indicators. Businessman using digital screen to analyze key performance indicators (KPI) with various graphs and charts, showcasing data analysis and performance tracking.
Data Processing in 3D Cityscape with Digital Interface
Cybersecurity Interface with Data Analysis Visualization
Digital Data Interface Over Cityscape Visualization Concept
Futuristic Global Data Analysis in Digital Server Environment
Premium
Data analysis science and big data with AI technology. An analyst or Scientist uses a computer and dashboard to analyze information on complex data sets on a computer. Insights development engineer.
Abstract Data Visualization and Infographics Interface
Abstract Financial Data Interface with Envelopes Symbolizing Digital Communication
Digital Data Interface Overlay on Urban Cityscape
Artificial Intelligence Data Processing Background
Premium
Analyst working with Business Analytics and Data Management System on computer to make report with KPI and metrics connected to database. Corporate strategy for finance, operations, sales, marketing
Financial Data Innovation in Modern Office with Digital Overlay
Digital Mail Processing with Financial Data Visualization
Futuristic Digital Data Interface with Blue Sci-Fi Graphics
Analyzing Complex Data Visualizations in Technology and Finance
Premium
Showing dashboard plotting line and bar charts on blue grid, with world map and numeric overlays. Analytics, visualization, data, technology, finance, dashboards, growth
Interactive Financial Dashboard with Playful Heart Graphics
Senior Doctor Analyzing Healthcare Financial Data Visualization
Wind Turbine Data Analysis in Renewable Energy Concept
Global Flash Sale E-commerce Banner
Premium
Analyst team utilizing BI Fintech to analyze financial report with tablet over paper on table and analyzing BI power dashboard display on tablet screen for business insight. Panorama shot. Scrutinize
Smartphone Displaying Notifications on Futuristic Circuit Board Interface
Digital Data Dashboard with Interactive Charts
Children Practicing Yoga Outdoors with Data Visualization
Abstract Digital Interface with Charts and Graphs
Premium
Explore how data analytics transforms decision-making processes with advanced visualization tools. interactive dashboards aiding businesses in understanding and leveraging their data effectively
Futuristic Abstract Data Analytics Overlay on Cityscape
Digital Dashboard with World Map and Analytics Charts
Digital Analytics Dashboard with Bar Charts and Metrics
Futuristic Digital City with VR Data Interface
Digital Charts and Graphs on Blue Technological Background
Abstract Digital Interface With Data and Technology Icons
Premium
Business Intelligence Dashboard visual display of Marketing Data Analytics provides of key metrics and KPI economic analysis and investment finance and marketing planning, Big data Graphs Charts.
Futuristic AI Data Processing Overlays on Dark Background
AI Chat Interface with Cloudy Background
Digital Financial Data over Urban Cityscape Visualization
Business Team Analyzing Data with Virtual Interface Displays
Premium
KPI data analytics concept, Key performance indicator analysis system. Information technology digital software management. Visualization tech solution. Business artificial intelligence. AI dashboard.
Financial Data Processing with Abstract Digital Interface
Futuristic Data Interfaces with DNA Strands Overlay
Floating Email Icons Over Blue Background Illustrating Digital Communication
Abstract Line Art Face with Geometric Patterns and Leaves
Premium
A high-tech environment featuring a hand interacting with a futuristic transparent touchscreen display, showcasing data analytics and digital visuals for business insights.
Futuristic Data Processing with Global Technology Interface Concept
Futuristic Data Processing Through Digital Cityscape
Abstract Financial Data Analysis with Digital Interface
Digital City Layout with Data Processing Visualization
Premium
Businessman analyze and visualize complex information on a virtual screen using AI to process data. Big data technology and data science.Data flow.Digital neural network.artificial intelligence
Colorful Financial Graphs and Data Visualization
Statistical Data Overlapping Modern Urban Skyline
Abstract Dashboard Interface Displaying Data Visualization
Futuristic Digital Interface with Abstract Data Visualization Elements
Premium
High-tech data visualization dashboard for analytics and performance tracking, including data visualization, trend, data report, and data chart. Marrow
Global Digital Communication Network with Notifications
Business Meeting with Team Analyzing Data on Laptop
Woman Engaging with Technology at Home with Data Overlay
Global Digital Connectivity Map with Network and Interaction Indicators
Premium
High-tech data visualization dashboard for analytics and performance tracking, including data visualization, trend, data report, and data chart. Marrow
Digital Data Codes on Blue Futuristic Network Interface
Global Digital Communication Across Continents
Digital Data Processing with Global Connections
Digital Financial Data Superimposed on Urban Skyline
Futuristic Data Analytics Over 3D Cityscape Visualization
Global Business Data Concept Over Modern Cityscape
Premium
Data analytics and insights powered by big data and artificial intelligence technologies. Data scientist working with complex information analysed by AI for business analytics dashboard with charts.
Futuristic E-commerce Business Data Analytics
Abstract Financial Data Overlay
Digital Infographic Display Over Modern Cityscape and Clear Sky
Digital Infographic Overlay on Cityscape Background
Premium
Professional data analyst using data visualizations dashboard on computer monitor for data business analysis and Data Management System
Futuristic Financial Data Visualization Against Urban Skyline
Digital Financial Data Interface on Dark Background
Global Social Media Engagement with Data Visualizations
Futuristic Data Visualization Interface with Sci-Fi Aesthetic
Premium
Business Analytics and Data Management System (DMS) giving key insights for corporate strategy. Concept with expert analyst building visualization with KPI and metrics from database information
Businessman Engaged in Data Analysis with Digital Interface
Digital Financial Data with Global Map Background Concept
Futuristic Data Visualization and Analysis Medical Monitoring
Futuristic Digital Network Accents Global Connection Conceptual Art
Premium
Displaying financial dashboard on screen showing bar charts, line graphs, gauges, percentage arrows. Technology, analytics, data visualization, dashboard, finance, digital, futuristic
Dynamic Pie Chart Interface with Global Map for Analytics
Global Financial Analytics on World Map Background
Futuristic AI Interface with Data Streams and Digital Mesh
Futuristic Digital Dashboard with Data Analytics Interface
Premium
High-tech data visualization dashboard for analytics and performance tracking, including data visualization, trend, data report, and data chart. Marrow
Urban Night Data Analytics Layout with Tech Overlay
Futuristic Data Analysis with Charts and Formulas on Digital Interface
Futuristic Wireframe Car with Digital Data Interface Elements
Abstract Futuristic Digital Data Visualization Concept
Premium
High-tech data visualization dashboard for analytics and performance tracking, including data visualization, trend, data report, and data chart. Vouch
Displaying floating social media notifications over dark analytics dashboard with metrics