
- Home >
- Stock Photos >
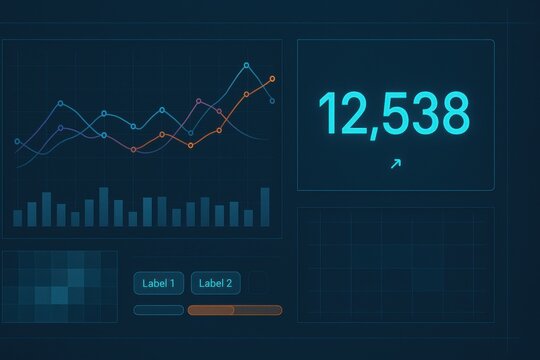
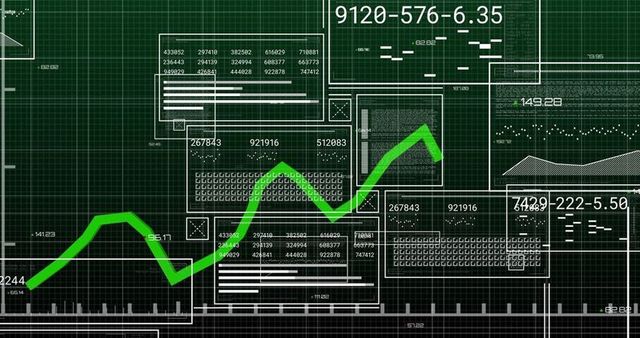
- Dynamic Data Visualization Panels with Neon Line Graph
Dynamic Data Visualization Panels with Neon Line Graph Image

This image features a vibrant, glowing orange line graph against a digital interface full of various data panels and histograms with striking purple and yellow streaks accentuating the background. This visual can be effectively used in presentations, websites, or articles related to data science, tech innovations, and digital analytics. Ideal for illustrating complex concepts in finance, business intelligence, or software technology. Perfect for designing eye-catching media content showcasing data analytics and futuristic technology.
Powered by 


downloads
Tags:
More
Credit Photo
If you would like to credit the Photo, here are some ways you can do so
Text Link
photo Link
<span class="text-link">
<span>
<a target="_blank" href=https://pikwizard.com/photo/dynamic-data-visualization-panels-with-neon-line-graph/ad126d1a7eaab10d514bf8f9e45f7a16/>PikWizard</a>
</span>
</span>
<span class="image-link">
<span
style="margin: 0 0 20px 0; display: inline-block; vertical-align: middle; width: 100%;"
>
<a
target="_blank"
href="https://pikwizard.com/photo/dynamic-data-visualization-panels-with-neon-line-graph/ad126d1a7eaab10d514bf8f9e45f7a16/"
style="text-decoration: none; font-size: 10px; margin: 0;"
>
<img src="https://pikwizard.com/pw/medium/ad126d1a7eaab10d514bf8f9e45f7a16.jpg" style="margin: 0; width: 100%;" alt="" />
<p style="font-size: 12px; margin: 0;">PikWizard</p>
</a>
</span>
</span>
Free (free of charge)
Free for personal and commercial use.
Author: Awesome Content
Similar Free Stock Images

Premium


Premium

Premium


Premium


Premium


Premium

Premium


Premium


Premium


Premium


Premium


Premium


Premium


Premium

Premium

Premium


Premium


Premium


Premium


Premium


Premium


Premium


Premium


Premium


Premium

Explore More Free Stock Images