
- Home >
- Stock Photos >
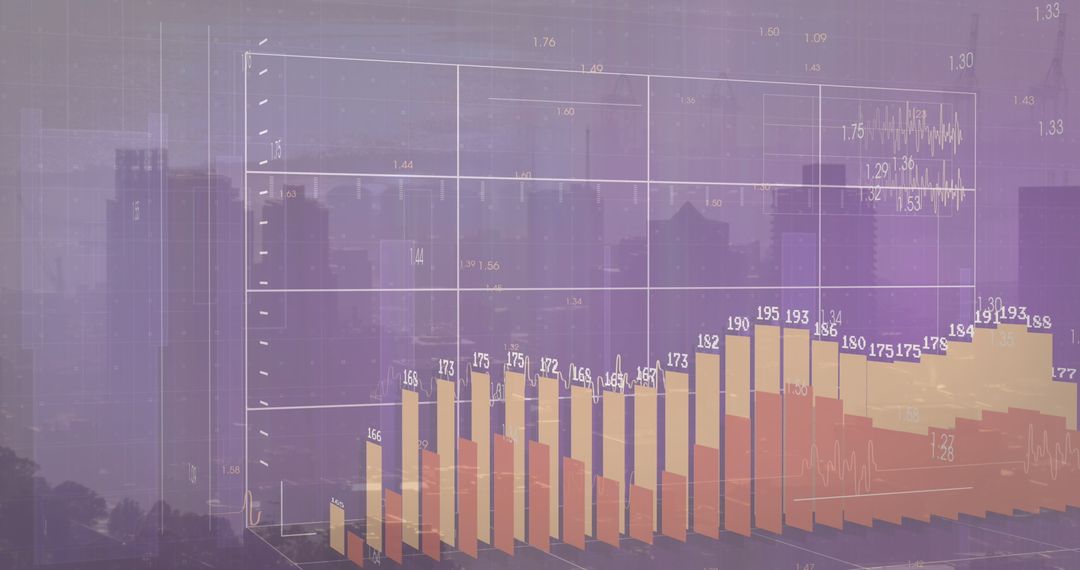
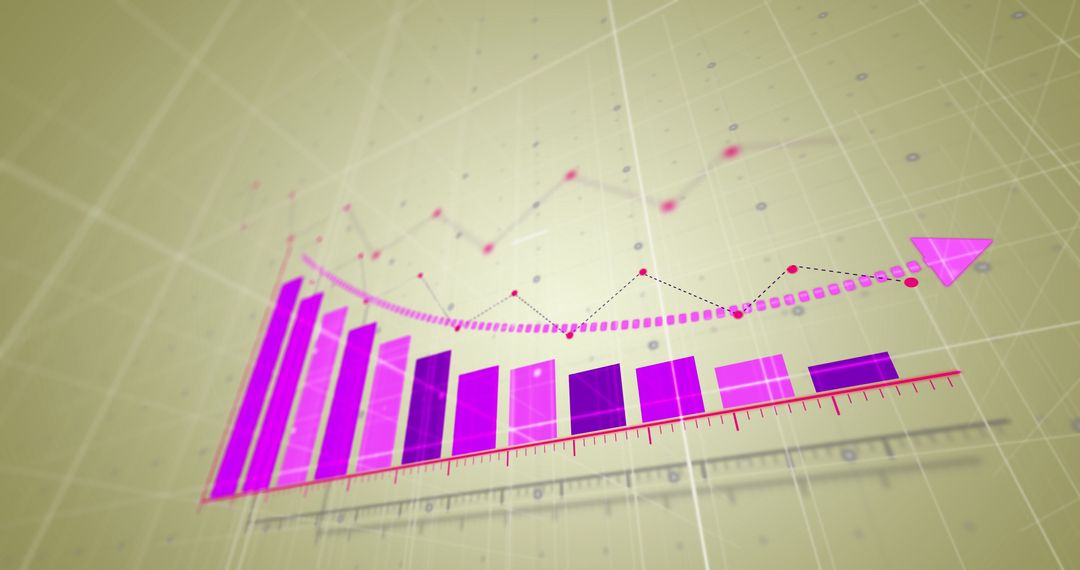
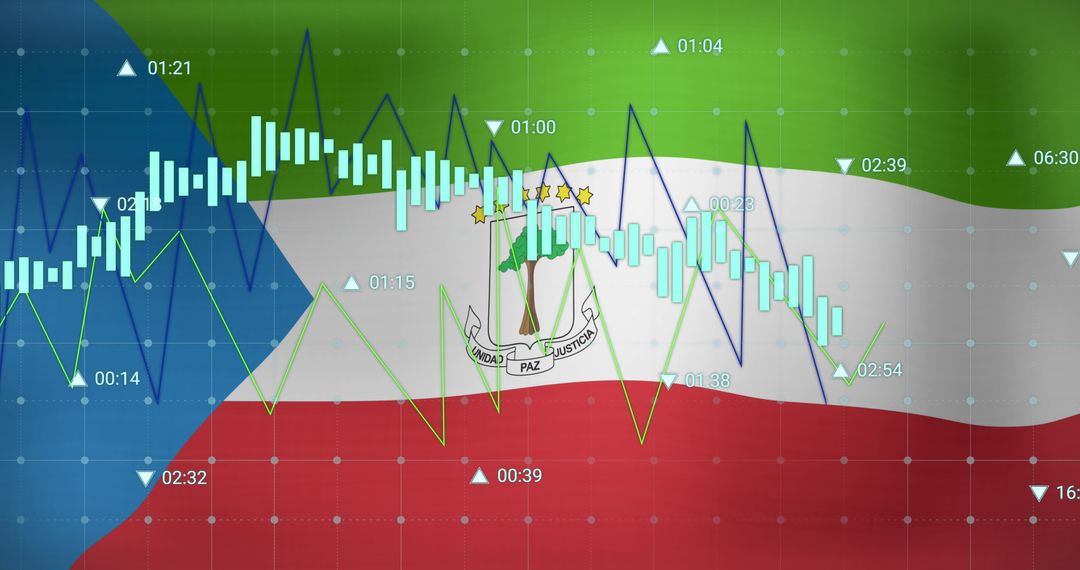
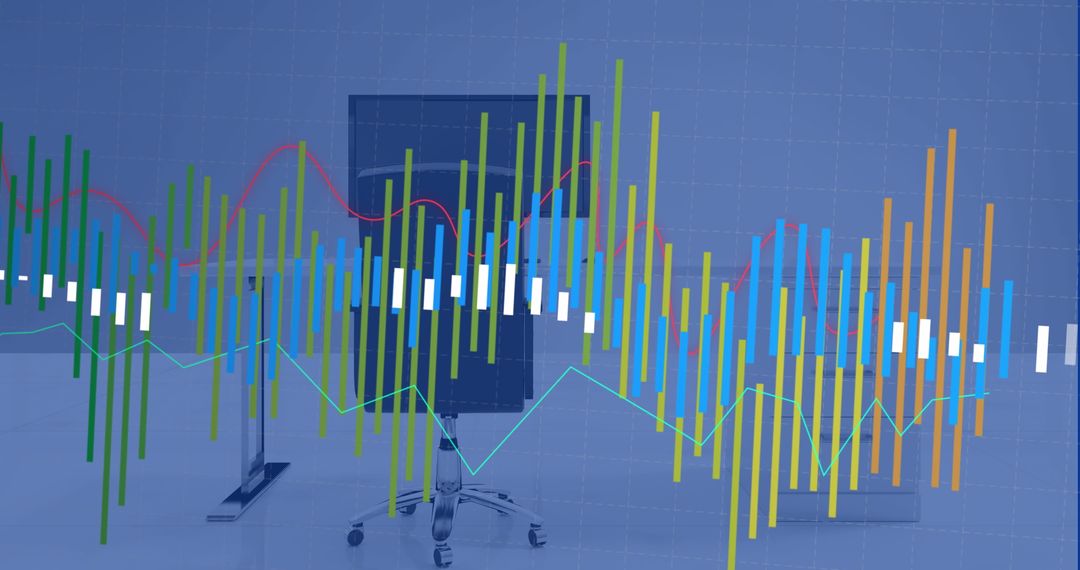
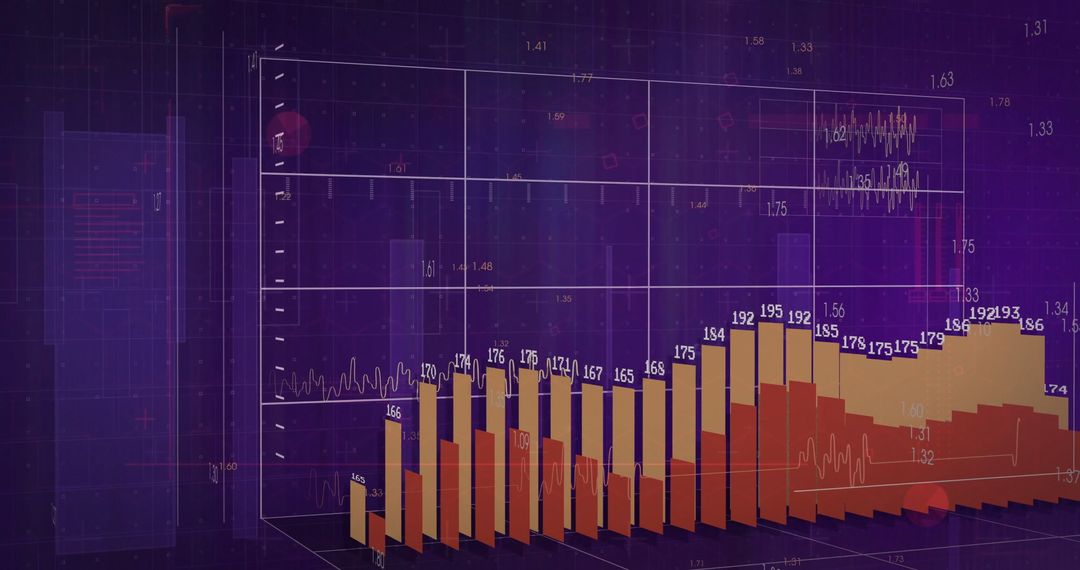
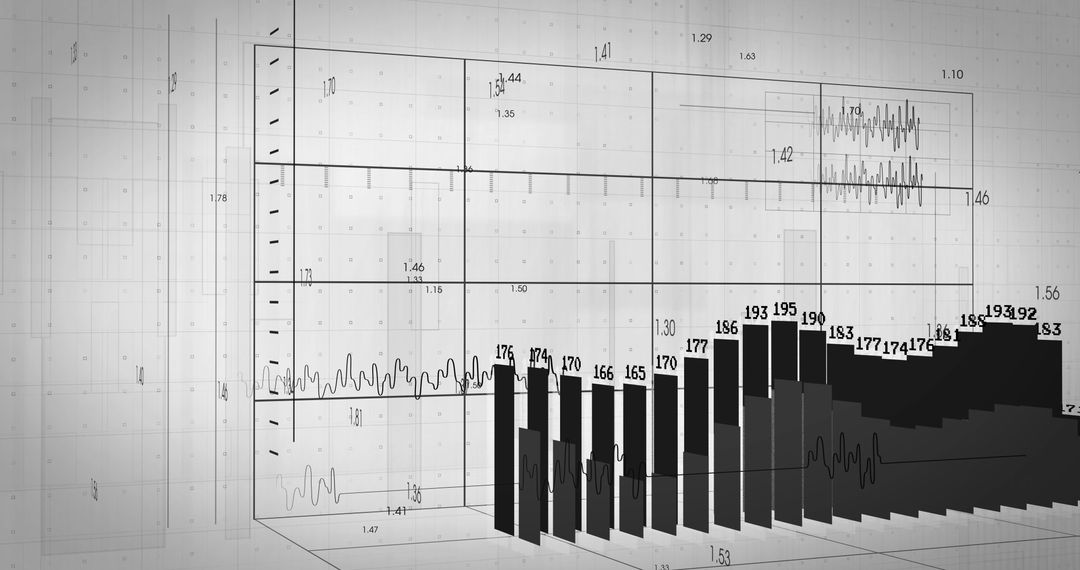
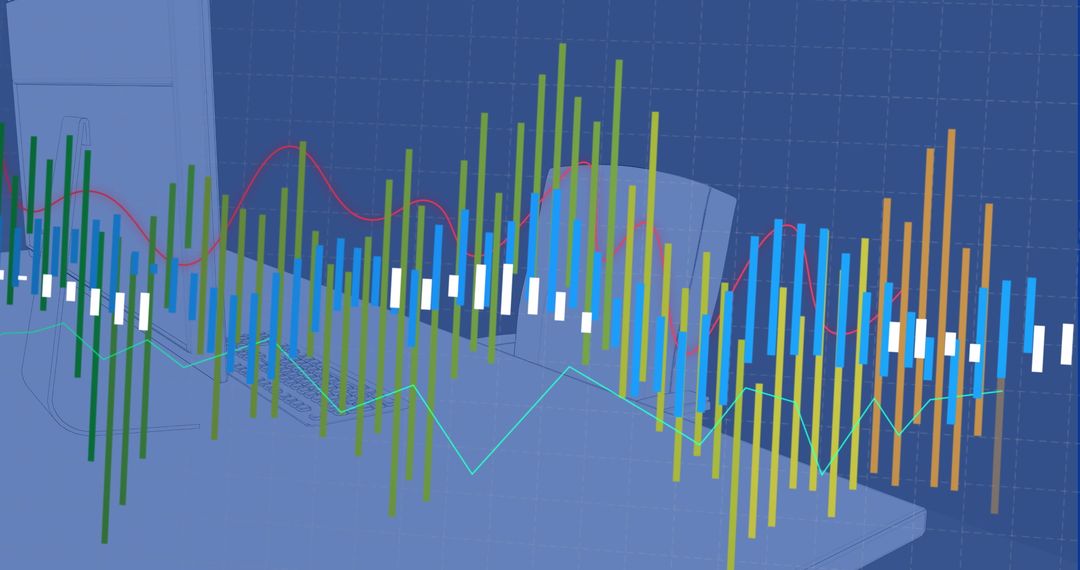
- Dynamic Data Visualization with Colorful Bar Charts
Dynamic Data Visualization with Colorful Bar Charts Image

Bar charts in vibrant shades overlaying a grid with numerical data and electronical waveforms, commonly used for financial analytics, presentations, and illustrating market trends. Useful in material highlighting value representations, data comparisons, and digital analytics concepts.
Powered by  - Get 15% off with code: PIKWIZARD15


0
downloads
downloads
Tags:
More
Credit Photo
If you would like to credit the Photo, here are some ways you can do so
Text Link
photo Link
<span class="text-link">
<span>
<a target="_blank" href=https://pikwizard.com/photo/dynamic-data-visualization-with-colorful-bar-charts/88af0c248c7634803b306139e7d05ad6/>PikWizard</a>
</span>
</span>
<span class="image-link">
<span
style="margin: 0 0 20px 0; display: inline-block; vertical-align: middle; width: 100%;"
>
<a
target="_blank"
href="https://pikwizard.com/photo/dynamic-data-visualization-with-colorful-bar-charts/88af0c248c7634803b306139e7d05ad6/"
style="text-decoration: none; font-size: 10px; margin: 0;"
>
<img src="https://pikwizard.com/pw/medium/88af0c248c7634803b306139e7d05ad6.jpg" style="margin: 0; width: 100%;" alt="" />
<p style="font-size: 12px; margin: 0;">PikWizard</p>
</a>
</span>
</span>
Free (free of charge)
Free for personal and commercial use.
Author: People Creations
Similar Free Stock Images

Premium


Premium


Premium


Premium


Premium


Premium


Premium


Premium


Premium


Premium


Premium


Premium


Premium


Premium


Premium


Premium


Premium


Premium


Premium


Premium


Premium


Premium


Premium


Premium

