- Home >
- Stock Photos >
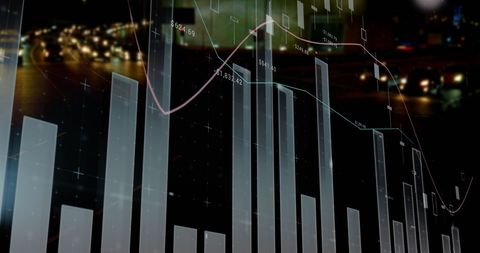
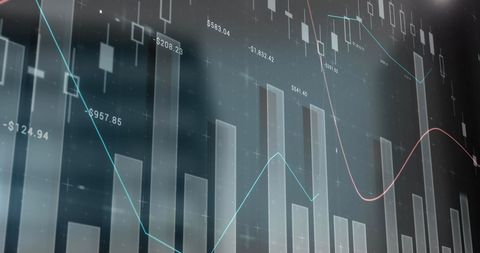
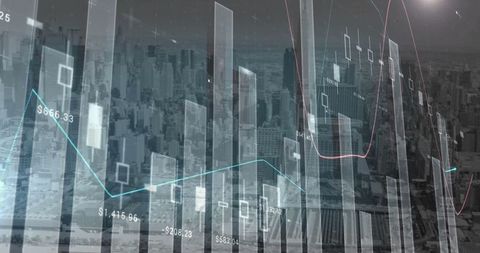
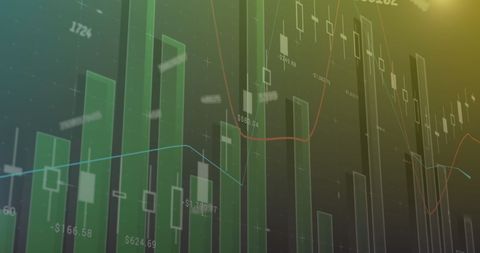
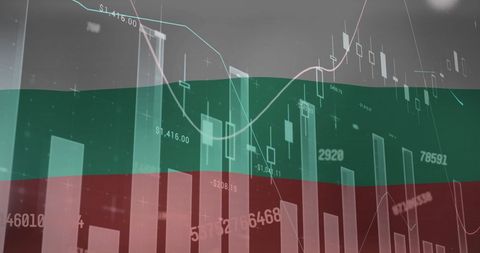
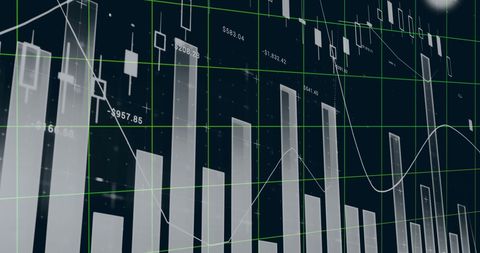
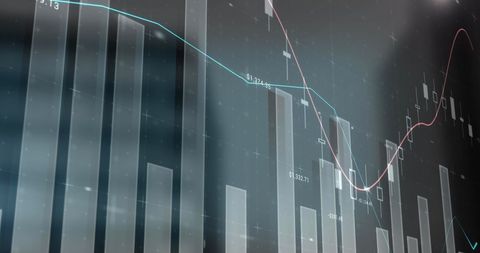
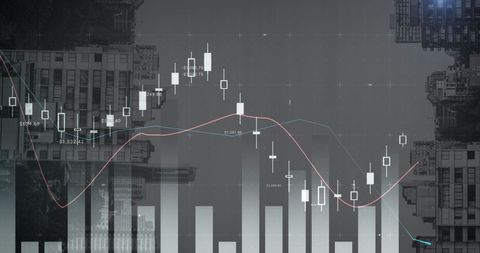
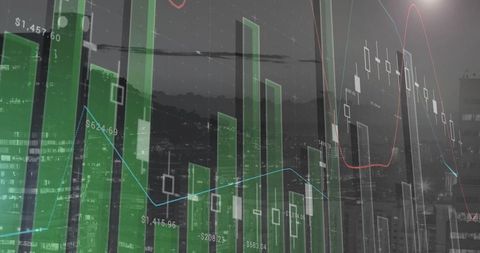
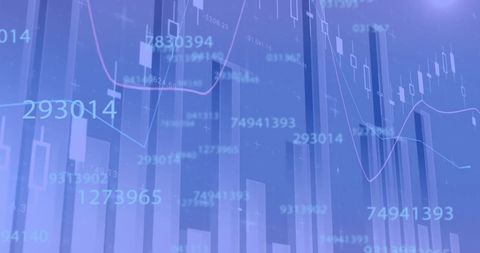
- Dynamic Data Visualization with Financial Charts and Bar Graphs
Dynamic Data Visualization with Financial Charts and Bar Graphs Image

Complex data visualization with financial charts and bar graphs, suitable for illustrating analytics and business presentations. Portrays the concept of data-driven decision making in modern technology and economy, as well as global markets, reports, and finance stream. Useful for infographic designs, financial technology articles, and educational materials on market trends.

downloads
Tags:
More
Credit Photo
If you would like to credit the Photo, here are some ways you can do so
Text Link
photo Link
<span class="text-link">
<span>
<a target="_blank" href=https://pikwizard.com/photo/dynamic-data-visualization-with-financial-charts-and-bar-graphs/26ce709d362734093cf14dab697ede91/>PikWizard</a>
</span>
</span>
<span class="image-link">
<span
style="margin: 0 0 20px 0; display: inline-block; vertical-align: middle; width: 100%;"
>
<a
target="_blank"
href="https://pikwizard.com/photo/dynamic-data-visualization-with-financial-charts-and-bar-graphs/26ce709d362734093cf14dab697ede91/"
style="text-decoration: none; font-size: 10px; margin: 0;"
>
<img src="https://pikwizard.com/pw/medium/26ce709d362734093cf14dab697ede91.jpg" style="margin: 0; width: 100%;" alt="" />
<p style="font-size: 12px; margin: 0;">PikWizard</p>
</a>
</span>
</span>
Free (free of charge)
Free for personal and commercial use.
Author: People Creations