
- Home >
- Stock Photos >
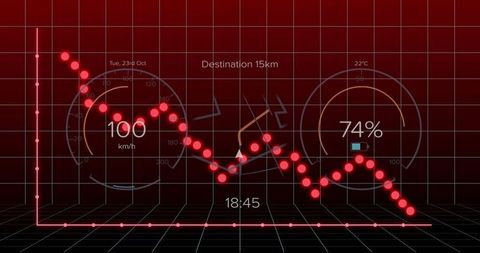
- Dynamic Data Visualization with Green Chart on Red Grid Background
Dynamic Data Visualization with Green Chart on Red Grid Background Image

A modern depiction of data visualization featuring a 3D chart with green points plotting a rising trend against a red grid. The floating numeric label, '22.95', suggests analysis results. Ideal for use in presentations on data analytics, business reviews, financial monitoring, technological advancements, articles related to statistical data, and digital surveillance displays.
Powered by 


downloads
Tags:
More
Credit Photo
If you would like to credit the Photo, here are some ways you can do so
Text Link
photo Link
<span class="text-link">
<span>
<a target="_blank" href=https://pikwizard.com/photo/dynamic-data-visualization-with-green-chart-on-red-grid-background/4ca70989d481bd69cae4a13ce9344b31/>PikWizard</a>
</span>
</span>
<span class="image-link">
<span
style="margin: 0 0 20px 0; display: inline-block; vertical-align: middle; width: 100%;"
>
<a
target="_blank"
href="https://pikwizard.com/photo/dynamic-data-visualization-with-green-chart-on-red-grid-background/4ca70989d481bd69cae4a13ce9344b31/"
style="text-decoration: none; font-size: 10px; margin: 0;"
>
<img src="https://pikwizard.com/pw/medium/4ca70989d481bd69cae4a13ce9344b31.jpg" style="margin: 0; width: 100%;" alt="" />
<p style="font-size: 12px; margin: 0;">PikWizard</p>
</a>
</span>
</span>
Free (free of charge)
Free for personal and commercial use.
Author: Creative Art
Similar Free Stock Images

Premium


Premium


Premium


AI


Premium

Premium


Premium


Premium

Premium


Premium


Premium


Premium


Premium

Premium


Premium

Premium

Premium


Premium


Premium


Premium


Premium


Premium


Premium


Premium

Premium


Premium


Explore More Free Stock Images