1. Home > 
  2. Stock Photos > 
  3. Dynamic Data Visualization with Interactive Charts and Graphs

Dynamic Data Visualization with Interactive Charts and Graphs Image

Dynamic Data Visualization with Interactive Charts and Graphs

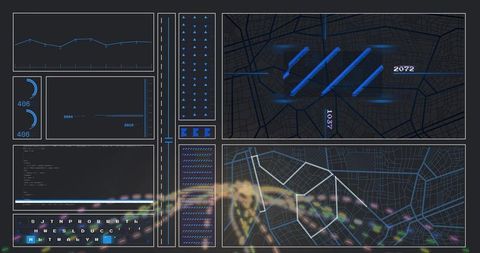
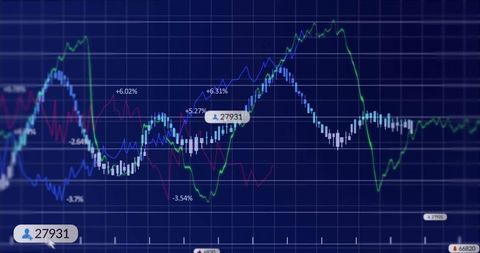
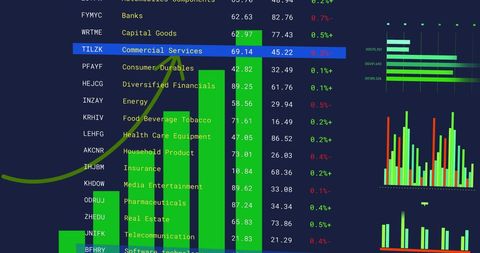
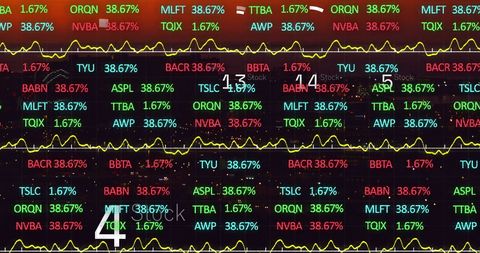
The display features a vibrant array of data visualization elements including vibrant line graphs, comprehensive numeric tables, impactful bar charts, and an innovative donut chart. This set is ideal for illustrating finance, business analytics, technology trends, or educational materials that focus on data interpretation. It is perfect for presentations, financial dashboards, and analytical reports that require a clear and sophisticated depiction of complex data sets. This composition conveys a sense of modern business efficiency and advanced analytical tools.

Powered by Adobe logo
Abstract representation of business analytics with a colorful wave pattern and line graph, symbolizing growth, data analysis, and financial progress in technology - Powered by AdobeAbstract analytics dashboard with bar chart and line graph visualization
 - Powered by AdobeNeon lit graph with rising arrows and increasing trend line - Powered by AdobeA green line graph showing a steady increase in growth over time - Powered by AdobeIndustrial analytics smart factory manufacturing production line dashboard machine learning data visualization predictive maintenance quality control efficiency - Powered by Adobe

Credit Photo

If you would like to credit the Photo, here are some ways you can do so

Free (free of charge)

Free for personal and commercial use.

Author: Awesome Content

Similar Free Stock Images

Financial Data Processing Over Digital Interface and Graphs
Premium
A person using a magnifying glass examines financial growth trends, represented by a dynamic bar and line graph overlaying a global map, illustrating importance of data analysis. Scalp
Financial Data Chart Over City Silhouette
Futuristic Analytics and Cybersecurity Dashboard Interface
Futuristic Financial Dashboard with Holographic Graphs
Financial Data Processing Terminal With Global Connections
Financial Data Projection in Modern Office Space
Premium
Neon glowing bars on futuristic circuit board, vibrant data visualization in dark space.
Premium
Abstract black and white financial graph with upward trend
Dynamic Financial Data Analytics Display with Graphs
Digital Data Processing with Graphical Interface
Digital Financial Data Interfaces in Global Connection
Futuristic Data Analysis Interface with Server Connections
Premium
Abstract digital data visualization with glowing blue and orange financial graph lines on a dark background representing market trends and data analysis
Financial Data Display in Digital Grid Design
Financial Data Processing with Charts and Graphics on Digital Blue Background
Digital Chart Display Financial Data Analysis Background Effects
Digital Finance Art with Graphs and Currency Symbols Overlapping
Premium
Colorful digital data visualization with glowing vertical bars and lines in warm and cool tones representing abstract technology and data analysis
Digital Dashboard with Line Charts and Data Analytics Visualization
Financial Data Processing Visualization on Dark Background
Sharp Decline in Stock Market Graph Against Red Financial Data Background
Digital Data Visualization and Analysis Interface
Premium
Businessman drawing growing shopping cart graph with glowing line
Premium
Digital innovation and intelligence shape future of data analysis and digital literacy technology driven environments with advanced visualization
Dynamic Stock Market Graph with Data Metrics Background
Futuristic Digital Waveform Analytics on Neon Green Interface
Dynamic Data Visualization Depicting Financial Growth Trends
Dynamic Data Visualization Displaying Interactive Waveforms
Premium
Tree roots and trunk forming an upward glowing line graph representing sustainable business growth, organic expansion, and natural development over time in a green forest environment
Abstract Financial Data Charts and Graphs on Black Background
Digital Financial Data Analysis with Infographics and Charts
Futuristic Financial Data Visualization and Digital Interface
Financial Data Stock Analysis with Code Overlays
Dynamic Digital Data Processing and Analysis Graphs
Dynamic Financial Data Analysis with Virtual Screen
Financial Graph Showing Indices Trends on Blue Background
Premium
Illustrative 3d rendering of a red bar graph showing steady upward progress indicated by a rising black line with an arrow symbolizing financial success and positive economic trends.
Digital Projection of Financial Data with Bar Graphs
Modern Data Dashboard Display with Interactive Charts
Digital Data Processing with Technology Interface on Blue Background
Digital DNA and Brain Data Interface Display in Dark Theme
Futuristic Financial Data Analysis Interface Concept
Premium
Abstract digital world map with glowing data points and graphical user interface elements displayed
Futuristic Data Visualization Dashboard with Neon Green Line Chart
Financial Analytics Dashboard with Dynamic Charts and Script Display
Digital Financial Data Interface with Graphs and Trends
Dynamic Cybersecurity Data Visualization Interface Screen
Premium
Abstract futuristic technology background with glowing lines charts and data visualization
Cybersecurity Dashboard With Data and Code Elements Display
Digital Data Visualization Over World Map in Network Concept
Digital Financial Charting and Data Processing on Black Background
Digital Trading Dashboard Showing Financial Data and Market Trends
Premium
A rising line graph with glowing data points superimposed on a vibrant sunset sky symbolizing growth and positive future trends
Futuristic Data Visualization with Vertical Bar Charts
Financial Analytics Data Visualization with Graphs and Charts
Futuristic Financial Data Analysis with Graphs and Charts
Dark Analytics Dashboard Displaying Financial Charts, Metrics and Neon Interface
Premium
businessman touching growth graph arrow line going up with business plan or market analysis on virtual screen, rising and growing concept of large "monstrous" figures. business suc
Dynamic Digital Stock Market Chart with Growing Financial Trends
Digital Dashboard Displaying Financial Market Analysis
Futuristic Digital Dashboard Interface with Analytics Graphics
Encrypted Data on Digital Interface with Analytics Charts
Digital Financial Data Processing and Analysis Graphics
Premium
waveform or parametric curve composed of neon lines, particles. Dynamic visual data is set against dark background with reflections, machine learning, sound technology, science visualization
Premium
Financial data visualization with green line and bar charts on black background
Premium
The illustration shows a vibrant green arrow graph trending upwards against a dark background with bokeh effects and grid lines, suggesting growth or progress.
Digital Financial Data Analysis on Futuristic Blue Interface
Financial Data Analytics on Digital Interface Displaying Graphs
Displaying Cyan Bar and Magenta Line Analytics Over Server Log Data on Dark Neon Dashboard
Digital Dashboard with Data Trends and Chat Technology Elements
Premium
A futuristic hand interacting with a holographic graph display of colorful data points and trend lines in a dark tech savvy environment
Layered Cybersecurity Displaying Terminal Access, Analytics, Pie and Candlestick Charts
Stock Market Analysis with Graphs and Trading Data
Financial Data Visualization with Dynamic Graphs and Charts
Dynamic Stock Market Analysis on Digital Screen
Premium
Green arrow pointing upward on financial graph. Business growth chart with rising trend line. Digital stock market data visualization for investment analysis
Futuristic Data Dashboard with Graphs and Numeric Visuals
Premium
Neon data dashboard with glowing blue, pink and purple panels, central circular gauge, side lists and a line graph on a dark background — futuristic analytics UI.
Dynamic Financial Data Processing in Modern Analytics
Holographic Finance Dashboard Displaying Glitchy Neon Data Streams, Binary Overlay
Premium
Abstract colorful data visualization with charts, graphs, and pie charts, isolated on white background
Dynamic Financial Trading Dashboard with Stock Tickers and Analytics
Financial Analytics Dashboard with Growth Trends and Indicators
Financial Data Processing on Digital Graph Displayed on Screen
Dynamic Digital Display of Financial Data
Abstract Data Visualization with Neon Waveforms
Colorful Financial Data Charts on Digital Grid Background
Stock Market Analysis and Data Processing Graphic
Dynamic Financial Trading Chart with Candlestick Graphs
Premium
Businessman drawing a rising graph line with glowing map pins in futuristic neon lighting for corporate presentation
Global Financial Data with Dynamic Analytics Visualization
Holographic Stock Market Analysis with Charts and Data
Dynamic Stock Market Ticker Display with Graphs
Digital Display of Financial Data with Graph and Figures
Visionary Financial Data Analysis on Digital Interface
Digital Interface with Data Processing Elements in Futuristic Display
Digital Interface with Data Processing Graphs and Analytics
Dynamic Stock Market Analysis with Multicolored Statistics
Cybersecurity Interface with Digital Shield Icon Displayed
Digital Financial Data Visualizations on Black Background
Abstract Graphic Business Data Visualization
Financial Graphs and World Map Illustrating Market Data
Digital Trading Analysis with Graphs and Trendlines
Premium
Dynamic digital financial graph with glowing purple and blue trend lines on dark background displaying market analytics data for investment technology
Dynamic Financial Graphs Illustrating Business Growth
Futuristic Data Analytics Dashboard with Charts and Code Onscreen
Digital Stock Market Data and Trends Visualization
Digital Financial Statistics and Analytics Visualization with Graphs
Global Financial Data and Stock Market Trends on World Map
Dynamic Financial Data Analysis and Graphs for Market Trends
Digital Financial Data Analysis on Abstract Blue Background
Holographic Financial Data Visualization with Stock Trends
Dynamic Data Visualization on Digital Dashboard Display
Premium
Dynamic graph displays upward trend, symbolizing growth and progress in data analysis. vibrant orange line contrasts against dark background, emphasizing positive trajectory
Digital Data Analytics with Financial Graphs and Indigo Background
Financial Data Charts with Network Connections Digital Interface
Dynamic Global Financial Data with Multicolored Graph Lines
Cyber Analytics Dashboard Showing Multicolor Waveforms on Neon Cyan Grid Interface
Premium
Abstract representation of rising financial trends illustrated with glowing line graph and data points on a dark grid background in a modern style
Financial Data Visualization with Graphs and Charts on Navy Background
Digital Financial Chart and Global Currency Symbols on Blue Background
Colorful Stock Market Display with Graphs and Tickers on Blue Background
Digital Interface Displaying Data Processing and Analytics Visuals
Premium
Business bar chart and line graph showing yearly business growth from 2022 to new year 2026, represent data analytics, future 2026 planning, business 2026 trend, and performance analysis 2026 Latch
Explore More Free Stock Images