- Home >
- Stock Photos >
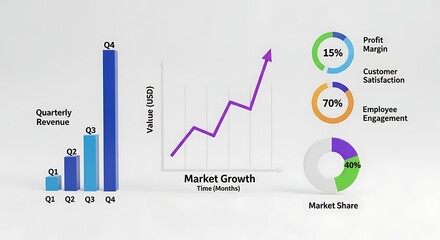
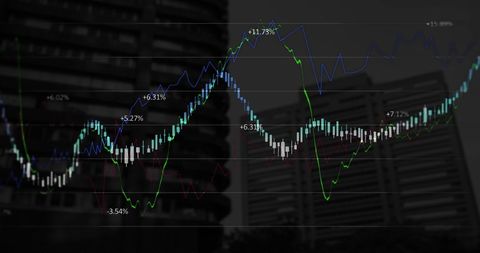
- Dynamic Data Visualization with Line and Bar Charts
Dynamic Data Visualization with Line and Bar Charts Image
This colorful depiction of digital data visualization showcases a combination of dynamic line and bar charts against a modern interface design. Ideal for presentations, business reports, financial analysis, and educational materials, it reflects innovation and precision in data handling. A perfect fit for projects focusing on finance, tech development, or business analytics, offering an engaging way to represent information visually.
Powered by 


downloads
Tags:
More
Credit Photo
If you would like to credit the Photo, here are some ways you can do so
Text Link
photo Link
<span class="text-link">
<span>
<a target="_blank" href=https://pikwizard.com/photo/dynamic-data-visualization-with-line-and-bar-charts/c69c70d032624517c30655c90963c502/>PikWizard</a>
</span>
</span>
<span class="image-link">
<span
style="margin: 0 0 20px 0; display: inline-block; vertical-align: middle; width: 100%;"
>
<a
target="_blank"
href="https://pikwizard.com/photo/dynamic-data-visualization-with-line-and-bar-charts/c69c70d032624517c30655c90963c502/"
style="text-decoration: none; font-size: 10px; margin: 0;"
>
<img src="https://pikwizard.com/pw/medium/c69c70d032624517c30655c90963c502.jpg" style="margin: 0; width: 100%;" alt="" />
<p style="font-size: 12px; margin: 0;">PikWizard</p>
</a>
</span>
</span>
Free (free of charge)
Free for personal and commercial use.
Author: Awesome Content
Similar Free Stock Images
Loading...

Premium


Premium


Premium

Premium


Premium


Premium


Premium


Premium

Premium


Premium


Premium


Premium


Premium
Premium

Premium


Premium


Premium

Premium


Premium


Premium

Premium
Premium

Premium


Premium


Premium