
- Home >
- Stock Photos >
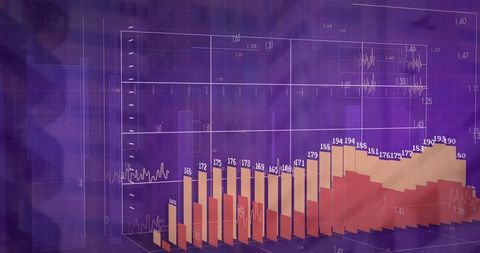
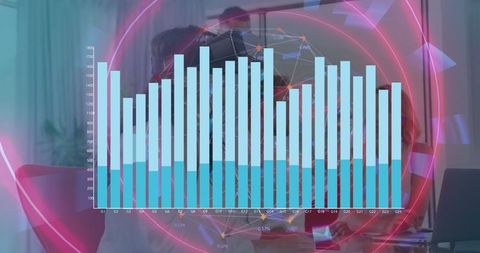
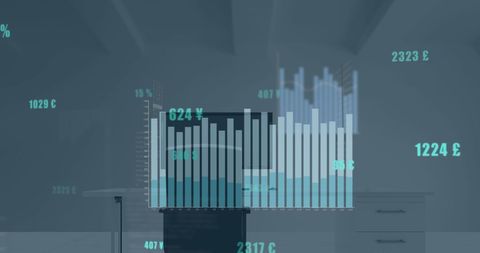
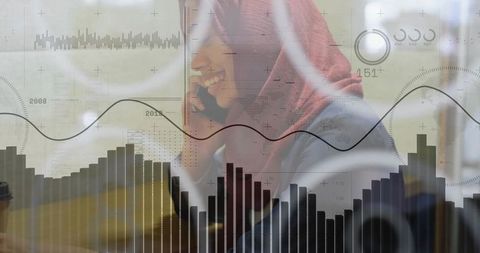
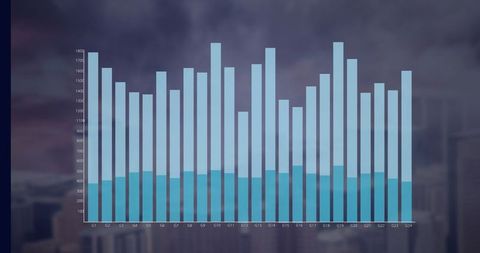
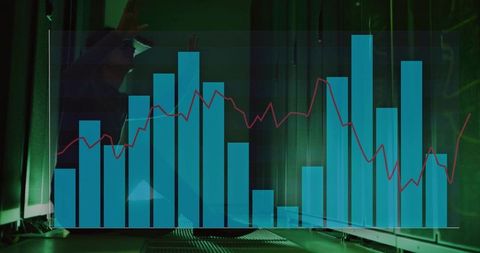
- Dynamic Data Visualization with Modern Graph Overlays
Dynamic Data Visualization with Modern Graph Overlays Image

Graphs overlay businesspeople's legs, illustrating connection between human interaction and data analytics. Ideal for presentations, reports, or articles about finance, global economy, and data-driven decisions.
Powered by  - Get 15% off with code: PIKWIZARD15


downloads
Tags:
More
Credit Photo
If you would like to credit the Photo, here are some ways you can do so
Text Link
photo Link
<span class="text-link">
<span>
<a target="_blank" href=https://pikwizard.com/photo/dynamic-data-visualization-with-modern-graph-overlays/fd11a81a240b48b53ffb7d0e5f62cf7d/>PikWizard</a>
</span>
</span>
<span class="image-link">
<span
style="margin: 0 0 20px 0; display: inline-block; vertical-align: middle; width: 100%;"
>
<a
target="_blank"
href="https://pikwizard.com/photo/dynamic-data-visualization-with-modern-graph-overlays/fd11a81a240b48b53ffb7d0e5f62cf7d/"
style="text-decoration: none; font-size: 10px; margin: 0;"
>
<img src="https://pikwizard.com/pw/medium/fd11a81a240b48b53ffb7d0e5f62cf7d.jpg" style="margin: 0; width: 100%;" alt="" />
<p style="font-size: 12px; margin: 0;">PikWizard</p>
</a>
</span>
</span>
Free (free of charge)
Free for personal and commercial use.
Author: People Creations
Similar Free Stock Images

Premium


Premium


Premium


Premium


Premium


Premium


Premium


Premium

Premium


Premium

Premium


Premium


Premium


Premium

Premium


Premium


Premium


Premium


Premium


Premium


Premium


Premium


Premium

Premium


Premium

Explore More Free Stock Images