1. Home > 
  2. Stock Photos > 
  3. Dynamic Data Visualization with Neon Line Graphs Against Cityscape

Dynamic Data Visualization with Neon Line Graphs Against Cityscape Image

Dynamic Data Visualization with Neon Line Graphs Against Cityscape

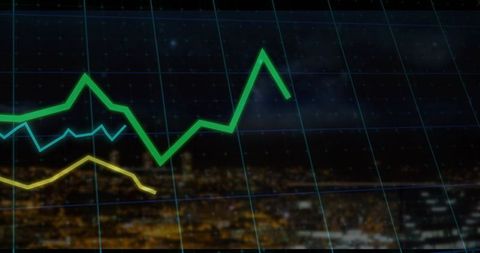
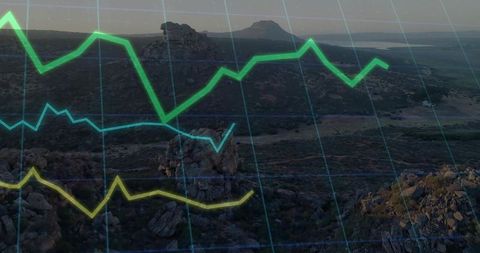
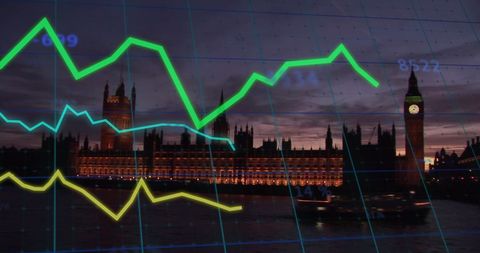
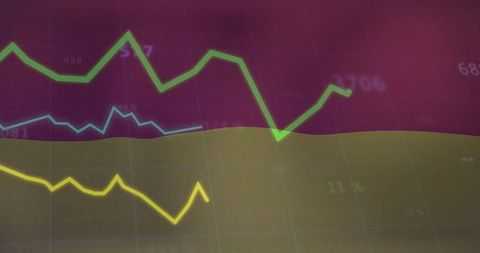
The image features vibrant neon line graphs overlaid on a blurred city skyline, representing concepts like financial growth, technology, or data analytics. The contrast of the bright lines against the dark urban backdrop offers a striking representation of market trends, financial patterns, or business intelligence. Ideal for presentations, websites, or articles focusing on analytics, digital innovation, or economic discussions, this compelling visual captivates ahead thinkers in collaborative brainstorms or enhances informational graphs with futuristic aesthetics.

Powered by Shutterstock logo - Get 15% off with code: PIKWIZARD15
Displaying neon financial chart with numeric labels and arrows spanning valley under overcast sky. Landscape, analytics, technology, innovation, eco-friendly, growth, data visualization - Powered by Shutterstock - Get 15% off with code: PIKWIZARD15Digital financial graphs overlaying a modern American cityscape, glowing neon lines and bars on a clear sky background, concept of urban economy trends - Powered by Shutterstock - Get 15% off with code: PIKWIZARD15Displaying widescreen finance board showing market trends in trading office with tickers and charts. Technology, analytics, investment, visualization, business, digital, enterprise - Powered by Shutterstock - Get 15% off with code: PIKWIZARD15Displaying digital stock market interface with neon ticker symbols and candlestick markers. Finance, data analysis, financial technology, stock trading, digital interface, investment, market trends - Powered by Shutterstock - Get 15% off with code: PIKWIZARD15Futuristic Green Financial Growth Chart - Powered by Shutterstock - Get 15% off with code: PIKWIZARD15

Credit Photo

If you would like to credit the Photo, here are some ways you can do so

Free (free of charge)

Free for personal and commercial use.

Author: Awesome Content

Similar Free Stock Images

Digital Finance Analytics with Stock Market Data
Premium
Financial market graph tracing line charts in trading dashboard, with map overlay and neon percents. Finance, analytics, technology, digital, investment, data, market
Financial Trends with Power Line Graphic Overlay
Global Economic Trends Highlighted on World Map with Graphs
Dynamic Financial Graph with Transparency Effect Overlay
Dynamic Financial Graph on Digital Background
Premium
Conceptual holographic display with bar and line graphs in hand, representing advanced business analytics and success. Concept of business, analytics, technology, innovations. Banner
Futuristic Digital Interface with Dynamic Financial Graph
Dynamic Data Charts on Geometric Abstract Background
Dynamic Forex Trading Graphs with Increasing Numbers
Dynamic Data Chart on Dark Digital Background
Graphical Data Analysis on Digital Interface
Data Analytics and Business Strategy Network Interface
Colorful Line Graphs Depicting Fluctuating Financial Trends
Colorful Financial Chart Representing Stock Market Trends
Fluctuating Stock Market Graph with Dramatic Peaks
Abstract Data Visualization with Retro Future Digital Interface
Dynamic Line Graph on Digital Data Background for Financial Analytics
Data Analytics Dashboard Displaying Growth Indicators
Fluctuating Green Line Chart on Digital Futuristic Dashboard
Rising Red Line Graph with Stock Market Candlesticks Overlay
Digital Financial Market Chart Visualization on Trading Screen
Financial Analysis Concept with Modern Chart Display
Neon Graph with Sunset Glow on Digital Grid Background
Dynamic Line Graphs Display on Transparent Digital Analytics Screen
Futuristic Digital Dashboard with Neon Line Charts Analysis
Dynamic Graph with Vibrant Lines on Black Background
Analyzing Graph Showing Market Economy Stock Crisis
Premium
Futuristic stock market chart with colorful candlesticks and glowing energy ring, symbolizing analytics, trading, and financial technology.
Energy Grid with Data Overlay Reflecting Economic Trends in Europe
Dynamic Stock Market Data Visualization on Digital Screen
Financial Growth Chart Overlay on City Skyline
Dynamic Global Market Trends Over World Map Visualization
Dynamic Multicolored Graphs on Abstract Digital Finance Background
Dynamic Digital Market Analysis with Holographic Data
Global Data Pulse on World Map Interface
Analyzing Financial Charts on Digital Screen
Financial Data Overlay on London Cityscape with Big Ben
Dynamic Stock Market Visual in Modern Office Setting
Green Line Graph Depicting Sustainability and Environmental Icons
Global Finance and Data Analytics in Server Environment
Dynamic Stock Market Analysis with Digital Graph Lines
Digital Security In Financial Analytics Showing Data Chart and Padlock
Futuristic Data Visualization with Interactive Line Graph and World Maps
Colorful Financial Chart with Heart Icons on Blue Background
Healthcare Professional Analyzing Medical Data with Trends
Colorful Financial Chart with Neon Line Graphs and Dynamic Numbers
Futuristic Holographic Globe with Digital Data Graph Overlay
Desert Landscape with Neon Data Analytics Overlay
Tri-Color Line Graph Overlaying Blurred Railway Scene
Line Graph Data Analytics Overlaid on Server Room Digital Grid
Vibrant Waveform Analysis on Futuristic Trading Screen
Financial Data Analysis with Vibrant Lines on Blue Background
Financial Data Analysis with Digital Grid Chart
Energy Efficiency with Data Analytics and Smart Infrastructure
Premium
Digital candlestick chart overlaying Seattle skyline at night, with glowing colors on a cityscape background, concept of financial analytics
Green Line Rising on Digital Trading Board with Abstract Background
Digital Financial Data Charts and Statistics Analysis
Global Data Analytics and Stock Market Visual Interface
Digital Financial Data Graph Showcasing Market Trends
Digital Stock Market Green Graph Against Dark Trading Board
Financial Data Processing with Rising Graphs
Financial Graphs Overlay Virtual Data Office Computers
Financial Data Analytics Overlaid on Swiss National Flag
Futuristic Data Analysis Overlaying Cityscape Digital Interface
Financial Data Visualization on World Map with Graph Analytics
Financial Graph with Data Analysis and Market Statistics
Financial Graphs Over Urban Cityscape Illustrating Dynamic Markets
Futuristic Digital Interface with Upward Trend Graph and C++ Code
Futuristic Analytics Graph with Cyan-Orange Line Trends
NFT Concept with Dynamic Line Graphs on Digital Grid Background
Business Professionals Analyzing Graphs in Modern Conference Room
Dynamic Line Graphs on Digital Analytics Dashboard Interface
Colorful Data Line Graphs on Digital Circuit Interface
Futuristic Data Analytics Dashboard with 3D Graph Visualization
Overlay of Line Graph Trends on Busy Highway Scene
Futuristic Data Dashboard with Colorful Line Graphs
Power Grid Data Visualization Over Rural Transmission Towers at Dusk for Energy Analytics
Dynamic Financial Market Trends with Data Visualizations
Financial Data Visualization with Rising Trends
World Map with Falling Line Graphs Indicating Global Economic Decline
Digital Fuel Sales Analysis with Graphical Data Interface
Premium
2026 Economic Growth Forecast with Rising Graphs and American Flag Overlay
Dynamic Stock Market Data Amid Empty Office Setting
Rising Graphs Over Cityscape Illustrating Financial Growth
Dynamic Stock Market Graphs Over Digital Interface
Financial Graphs Displaying Business Trends on Grid Background
Dynamic Financial Data Analyzing with Graph Overlays
Financial Data Graph Overlay on Modern Office Background
Financial Growth Data Overlay on Urban Skyline
Futuristic Financial Data Analysis with Rising White Line Graph
Abstract Financial Data Processing and Analysis Interface
Armenian Flag with Financial Graph Overlay Depicting Market Trends
Green Line Graph Displaying Financial Market Trends on Digital Screen
Digital Dashboard with Colorful Data Visualization
Colorful Line Graphs with Candlestick Markers on Digital Interface
Dynamic Data Analytics Display with Multicolored Graph Lines
Green Line Graph Over Urban Skyline Data Visualization
Futuristic Neon Green Data Visualization on Grid Background
Rising Green Financial Line Graph with Data Annotations
Abstract Digital Dashboard with Green Graph
Digital Data Analysis and Visualization with Line Graph
Futuristic Digital Dashboard Displaying Rising Trend Lines CG Model
Neon Green Market Line Chart Real-Time Financial Data on Futuristic Holographic Grid