- Home >
- Stock Photos >
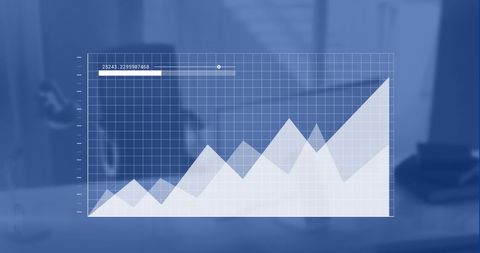
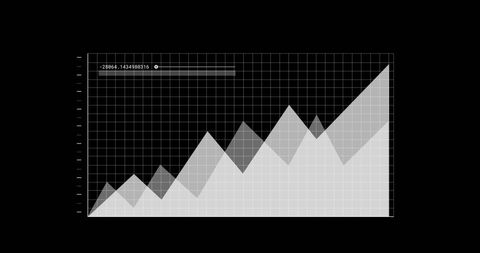
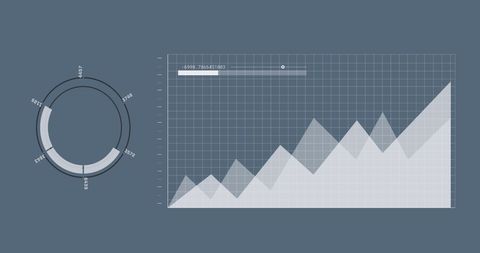
- Dynamic Data Visualization with Progress and Analytics Chart
Dynamic Data Visualization with Progress and Analytics Chart Image

The display showcases a grid with an area chart that visually represents data trends. Accompanied by a vibrant purple progress bar and a numeric label, it conveys information effectively for business and analytical purposes. This design is ideal for presentations, dashboards, user interfaces, and educational tools focused on data science, gradual data progression, technology development, and analytics-oriented content.
Powered by  - Get 15% off with code: PIKWIZARD15


downloads
Tags:
More
Credit Photo
If you would like to credit the Photo, here are some ways you can do so
Text Link
photo Link
<span class="text-link">
<span>
<a target="_blank" href=https://pikwizard.com/photo/dynamic-data-visualization-with-progress-and-analytics-chart/a93c32034a90345653b23bfc58c8cebe/>PikWizard</a>
</span>
</span>
<span class="image-link">
<span
style="margin: 0 0 20px 0; display: inline-block; vertical-align: middle; width: 100%;"
>
<a
target="_blank"
href="https://pikwizard.com/photo/dynamic-data-visualization-with-progress-and-analytics-chart/a93c32034a90345653b23bfc58c8cebe/"
style="text-decoration: none; font-size: 10px; margin: 0;"
>
<img src="https://pikwizard.com/pw/medium/a93c32034a90345653b23bfc58c8cebe.jpg" style="margin: 0; width: 100%;" alt="" />
<p style="font-size: 12px; margin: 0;">PikWizard</p>
</a>
</span>
</span>
Free (free of charge)
Free for personal and commercial use.
Author: Creative Art