- Home >
- Stock Photos >
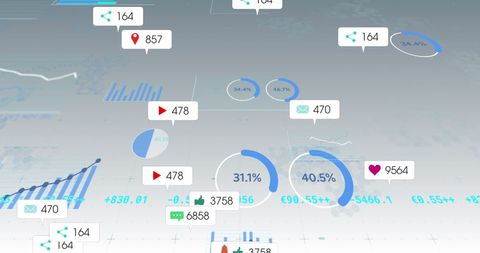
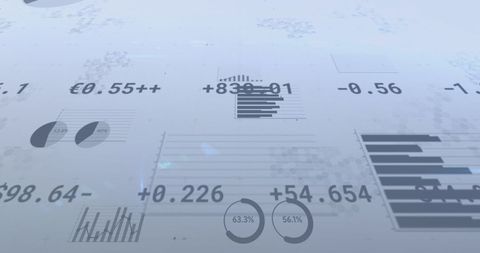
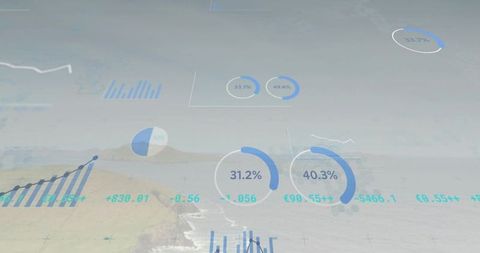
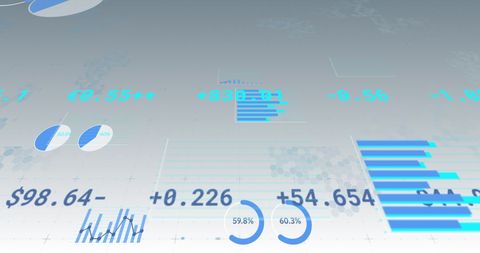
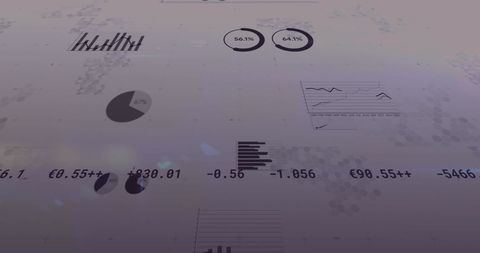
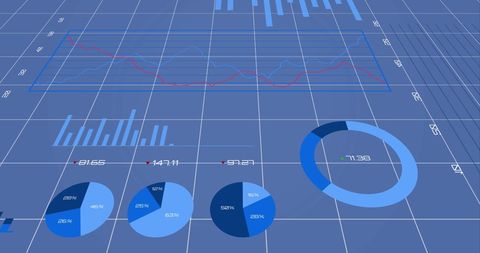
- Dynamic Data Visualization with Statistical Interface and Numerical Analysis
Dynamic Data Visualization with Statistical Interface and Numerical Analysis Image
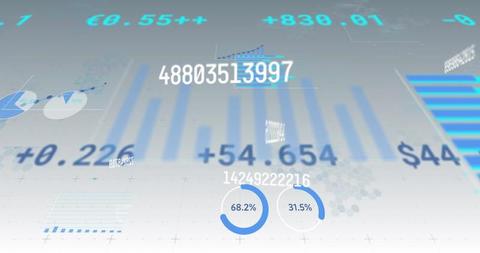
This illustration showcases a digital interface with changing numerical data and statistical elements, aimed at conveying data analysis processes. Suitable for illustrating topics in financial technology, business intelligence software presentations or technological process overviews.

downloads
Tags:
More
Credit Photo
If you would like to credit the Photo, here are some ways you can do so
Text Link
photo Link
<span class="text-link">
<span>
<a target="_blank" href=https://pikwizard.com/photo/dynamic-data-visualization-with-statistical-interface-and-numerical-analysis/ebcbbc27da5cdc8567cf743c039d81d9/>PikWizard</a>
</span>
</span>
<span class="image-link">
<span
style="margin: 0 0 20px 0; display: inline-block; vertical-align: middle; width: 100%;"
>
<a
target="_blank"
href="https://pikwizard.com/photo/dynamic-data-visualization-with-statistical-interface-and-numerical-analysis/ebcbbc27da5cdc8567cf743c039d81d9/"
style="text-decoration: none; font-size: 10px; margin: 0;"
>
<img src="https://pikwizard.com/pw/medium/ebcbbc27da5cdc8567cf743c039d81d9.jpg" style="margin: 0; width: 100%;" alt="" />
<p style="font-size: 12px; margin: 0;">PikWizard</p>
</a>
</span>
</span>
Free (free of charge)
Free for personal and commercial use.
Author: Creative Art