- Home >
- Stock Photos >
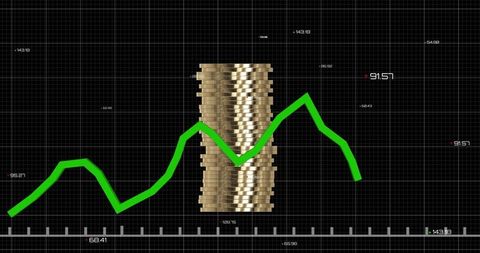
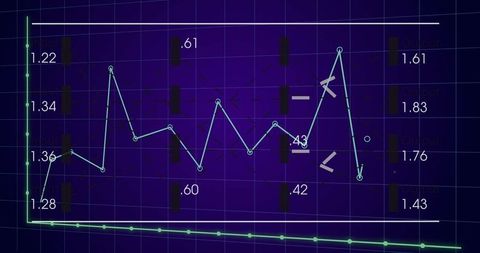
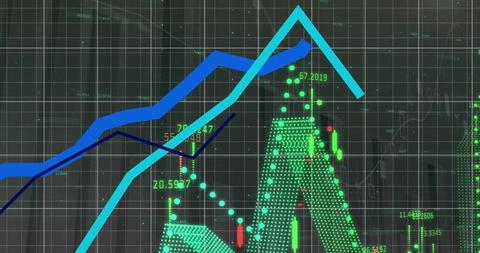
- Dynamic Data Visualization with Virtual Graphs and Numbers
Dynamic Data Visualization with Virtual Graphs and Numbers Image

Display combines financial concepts of growth and reduction with digital art. Useful for illustrating economic reports, technology advancements, business analytics, and the evolving nature of financial data analysis.

downloads
Tags:
More
Credit Photo
If you would like to credit the Photo, here are some ways you can do so
Text Link
photo Link
<span class="text-link">
<span>
<a target="_blank" href=https://pikwizard.com/photo/dynamic-data-visualization-with-virtual-graphs-and-numbers/b84653721d06bf6fe4bdf32f1d2d54f2/>PikWizard</a>
</span>
</span>
<span class="image-link">
<span
style="margin: 0 0 20px 0; display: inline-block; vertical-align: middle; width: 100%;"
>
<a
target="_blank"
href="https://pikwizard.com/photo/dynamic-data-visualization-with-virtual-graphs-and-numbers/b84653721d06bf6fe4bdf32f1d2d54f2/"
style="text-decoration: none; font-size: 10px; margin: 0;"
>
<img src="https://pikwizard.com/pw/medium/b84653721d06bf6fe4bdf32f1d2d54f2.jpg" style="margin: 0; width: 100%;" alt="" />
<p style="font-size: 12px; margin: 0;">PikWizard</p>
</a>
</span>
</span>
Free (free of charge)
Free for personal and commercial use.
Author: Awesome Content