- Home >
- Stock Photos >
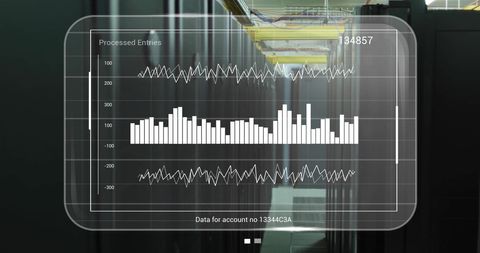
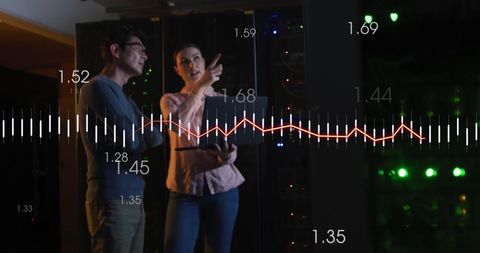
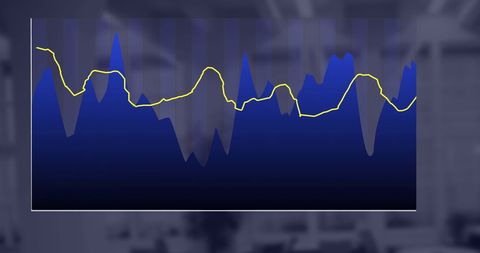
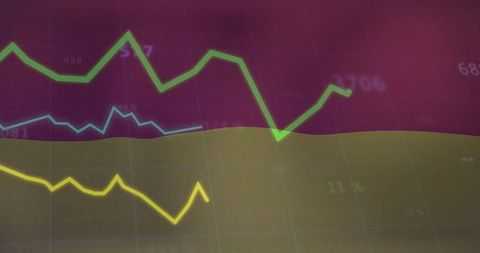
- Dynamic Data Visualization with Waveform and Analytical Interface
Dynamic Data Visualization with Waveform and Analytical Interface Image

Image showcasing data visualization with waveform stretching across digital interface, incorporating green bars and globe outline, convey innovative analytical methods and trends. Useful for illustrating technology articles, analytics platforms, data science projects, or presentations on cutting-edge data solutions.

downloads
Tags:
More
Credit Photo
If you would like to credit the Photo, here are some ways you can do so
Text Link
photo Link
<span class="text-link">
<span>
<a target="_blank" href=https://pikwizard.com/photo/dynamic-data-visualization-with-waveform-and-analytical-interface/63af404e110265bd5d4ae543c5077c5f/>PikWizard</a>
</span>
</span>
<span class="image-link">
<span
style="margin: 0 0 20px 0; display: inline-block; vertical-align: middle; width: 100%;"
>
<a
target="_blank"
href="https://pikwizard.com/photo/dynamic-data-visualization-with-waveform-and-analytical-interface/63af404e110265bd5d4ae543c5077c5f/"
style="text-decoration: none; font-size: 10px; margin: 0;"
>
<img src="https://pikwizard.com/pw/medium/63af404e110265bd5d4ae543c5077c5f.jpg" style="margin: 0; width: 100%;" alt="" />
<p style="font-size: 12px; margin: 0;">PikWizard</p>
</a>
</span>
</span>
Free (free of charge)
Free for personal and commercial use.
Author: Creative Art