
- Home >
- Stock Photos >
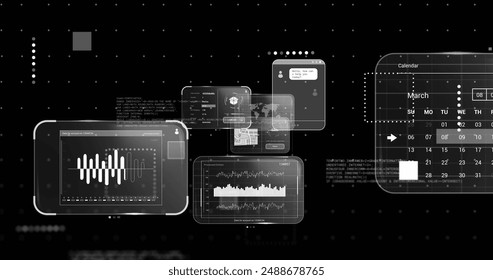
- Dynamic Diagrams of Data Processing on Digital Interface
Dynamic Diagrams of Data Processing on Digital Interface Image

Diagrams overlaid on a data-rich, digital interface, illustrating dynamic analysis and processing in a technology context. It evokes a futuristic and highly technological environment. Useful for projects focused on computer networking, modern technology research, analytical services, or information systems development.
Powered by  - Get 15% off with code: PIKWIZARD15


downloads
Tags:
More
Credit Photo
If you would like to credit the Photo, here are some ways you can do so
Text Link
photo Link
<span class="text-link">
<span>
<a target="_blank" href=https://pikwizard.com/photo/dynamic-diagrams-of-data-processing-on-digital-interface/9393a7695e6661d6d43daafd7b904bf5/>PikWizard</a>
</span>
</span>
<span class="image-link">
<span
style="margin: 0 0 20px 0; display: inline-block; vertical-align: middle; width: 100%;"
>
<a
target="_blank"
href="https://pikwizard.com/photo/dynamic-diagrams-of-data-processing-on-digital-interface/9393a7695e6661d6d43daafd7b904bf5/"
style="text-decoration: none; font-size: 10px; margin: 0;"
>
<img src="https://pikwizard.com/pw/medium/9393a7695e6661d6d43daafd7b904bf5.jpg" style="margin: 0; width: 100%;" alt="" />
<p style="font-size: 12px; margin: 0;">PikWizard</p>
</a>
</span>
</span>
Free (free of charge)
Free for personal and commercial use.
Author: Awesome Content
Similar Free Stock Images

Premium


Premium


Premium


Premium


Premium


Premium


Premium


Premium


Premium


Premium


Premium


Premium


Premium


Premium


Premium

Premium


Premium


Premium


Premium


Premium


Premium


Premium


Premium


Premium


Premium


Explore More Free Stock Images