1. Home > 
  2. Stock Photos > 
  3. Dynamic Digital Dashboard with Analytical Data Insights

Dynamic Digital Dashboard with Analytical Data Insights Image

Dynamic Digital Dashboard with Analytical Data Insights

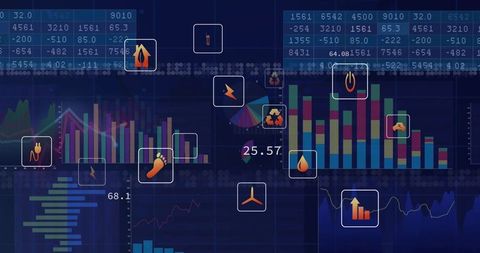
Futuristic digital dashboard displays various charts and graphs, including line graph, numeric panels, and bar charts, conveying comprehensive data insights. Ideal for use in articles, presentations, and advertising materials related to technology, data analytics, business intelligence, and innovation. The image projects a sense of advanced technology and modern analytical capabilities.

Powered by Adobe logo
Digital dashboard with colorful bars - Powered by AdobeDigital Dashboard Displays Showing Financial Data and Analytics finance charts - Powered by AdobeProfessional social media marketing dashboard on laptop showing Google ads metrics, AI analytics, colorful charts in modern office setup with clean minimalist design - Powered by AdobeFuturistic Business Analytics with Holographic Data Display on Office Desk - Powered by AdobeA business professional engages with financial data on a laptop, surrounded by innovative graphs and charts that signify growth and success in a corporate environment. Scalp - Powered by Adobe

Credit Photo

If you would like to credit the Photo, here are some ways you can do so

Free (free of charge)

Free for personal and commercial use.

Author: Creative Art

Similar Free Stock Images

Dynamic Data Visualization with Modern Interface and Global Insights
Premium
Close-up of a digital display showing various charts and graphs in blue and orange hues, representing data analysis and business intelligence, ideal for technology or financial concepts
Futuristic Data Analytics Display on Office Windows
Advanced Analytics Dashboard with Holographic Globe and Visual Data
Digital Financial Analytics with Dynamic Graphs and Code Interface
City Skyline with Financial Data Visualization Overlay
Financial Data Processing with Digital Graphs and Numbers
Digital Data and Circuit Board Interface
Global Financial Dashboard with Red Downward Trend Line Graph
Digital Skull and Crossbones Overlay with Code and Graphs
Abstract Digital Data Interface and Global Business Analytics
Cybersecurity Concept with Digital Warning Text Over Blue Cityscape
Premium
Hand pointing at interactive dashboard with analytics graphs and charts on a large touchscreen display, highlighting data trends and performance metrics in a modern digital workspace.
Premium
Businessman using digital dashboard with holographic graphs and charts on laptop and stylus representing data analysis financial report business strategy and modern technology for decision making
Premium
Business professional analyzes financial reports and builds charts in a spreadsheet on a desktop computer in a modern office with colleagues working in the background
Digital Data Processing and Analytics in Modern Business Innovation
Financial Data Analytics Overlay on Digital Code Interface
Global Business Data with World Map and QR Code Visualization
Futuristic Data Analytics Overlay on Server Racks with Digital Charts
Digital Interface with Financial Data Analytics and Graphs
Cityscape Overlayed by Bar and Line Charts Representing Financial Data
Digital Financial Data Visualization Over World Map
Dynamic Stock Market Data on Digital Display Background
Premium
Visual representation of digital marketing metrics and ads on a futuristic interface, showcasing data analysis through charts and graphs in a modern business setting. Gantry
Pandemic Impact Illustrated with Graph and World Graphic
Abstract Digital Data Visualization with Financial Graphs
Abstract Landscape with Financial Data and Global Connections
Futuristic Interface with Data Visualization and Technology Elements
Premium
Modern business dashboard displays key performance indicators via interactive charts and graphs on a digital screen,  graphs,  KPI
Digital Security with Global Connections and Data
Futuristic Financial Analytics with Digital Trends in Urban Setting
Global Data Analytics and Network Visualization on Digital Grid
Neon finance analytics dashboard streaming binary code with volatile line charts
DNA Helix Intertwined with Financial Graphs and Computer Code
Cybersecurity Technology with Digital Data Interface Design
Digital Dashboard with Data Analysis Charts and Graphs
Financial Data Dashboard with Multi-Color Bar and Line Graphs
Premium
Expert presentation shows marketing strategy resource overview via infographic pie chart graph datum tracking indicator statistic report business ai
Virtual Data Dashboard with Analytics and Visualization Features
Digital Data Analysis and Processing in Technological Environment
Digital Financial and Statistical Data Display Technology
Stock Market Data Visualization With Bar and Line Graphs
Premium
Futuristic holographic data hub with glowing blue towers and floating analytical dashboards displaying charts and graphs.
Colorful Financial Graphs and Data Visualization
Digital Financial Data Processing Interface with Graphs and Codes
Digital World Map Interface with Data Analytics Overlay
Futuristic Energy Dashboard Interface for Data Visualization
Premium
Team reviewing marketing performance data on large screen in office meeting.
Concept: Marketing analytics, strategy, tracking, teamwork, KPIs, business growth.
Digital Global Financial Data Display with World Map
Futuristic Digital Dashboard with 3D Globe and Data Visualizations
Data Processing with Futuristic Interface Overlay Cityscape
Financial Data Overlay on Office Desk with Visible Growth Chart
Financial Data Visualization with Global Connections
Technology and Science Analytics with Dashboard Visualization
Dynamic Financial Data Chart with Abstract Geometric Network
Digital Data Analytics Display with Global Business Interface
Futuristic Financial Data Visualization with Grids and Analytics
Premium
Businessman Analyzing Data Charts On Laptop
Rising Candlestick Chart on Dynamic Digital Financial Display
Digital Stock Market Analysis with Falling Trend Arrow
Digital Interface Featuring Financial Data and Charts in 4K
Futuristic Financial Data Projection Over Urban Skyline
Premium
Professional social media marketing dashboard on laptop showing Google ads metrics, AI analytics, colorful charts in modern office setup with clean minimalist design
Global Financial Data on Digital Interface Background
Digital Analytics Dashboard with Charts and Percent Metrics
Premium
Data Analyst Using Data Analytics KPI
Premium
A collection of business charts and graphs representing data analysis and performance tracking metrics
Premium
A professional analyzing financial data using a digital tablet with dynamic charts and graphs.
Layered Interface With Charts and Tickers for Trading Apps
Doctor Integrating Data Analytics in Modern Healthcare Technology
Innovative Data Visualization with Digital Line Graphs Interface
Abstract Financial Data Visualization on Digital Screens
Financial Analytics Dashboard with Charts and Trend Line
Futuristic Digital Grid with Glowing Squares and Circuit Lines
Analytics Dashboard with Trend Lines and Code Snippets
Abstract Digital Financial Chart with Futuristic Data Visualization
Futuristic Data Dashboard with Dynamic Analytics and Coding Elements
Digital Cloud Network with Cybersecurity Elements Overlay
Futuristic Trading Dashboard with Data Visualization Elements
Digital Trade Success with Floating Thumbs Up Among Green Charts
Premium
Marketer using digital marketing dashboard with charts, pie graphs, organization chart, and performance data. Concept of business analytics and strategic planning.
Financial Graphs on Night Cityscape Highlights Economy
Futuristic Digital Data Interface with Binary Code and Graphs
Advanced Financial Data Processing Chart Visualization
Premium
Futuristic Holographic Data Visualization in Hand with Charts and Graphs
Premium
AI finance business data analysis digital technology investment trading market stock, financial analyst using advanced holographic interface for global market insight, smart investment strategy
Cybersecurity Threats Impacting Global Financial Markets
Digital Data Processing Overlay with Graphs and Charts
Analyst Interacting with Holographic Data Displays in Office
Data Center Analytics with Digital Visualization Overlay
Premium
An analyst uses a computer and dashboard for data business analysis and Data Management System with KPI and metrics connected to the database for technology finance, operations, sales, marketing
Dynamic Financial Data Visualization with Charts and Arrows
Futuristic Digital Analytics Dashboard with Charts and Tables
Futuristic Streaming Analytics Dashboard with Data Visualization
Global Financial Data over World Map Background
Statistical Analysis Overlay in Modern Data Center
IT Engineer Analyzing Holographic Data in Futuristic Server Corridor
Abstract Digital Financial Chart with Neon Candlesticks
Financial Data Visualization with Charts and Graphs on Dashboard
Dynamic Financial Data Analysis Interface with Digital Charts
Futuristic Financial Data Visualization with Large Letter A
Premium
Futuristic data visualization with glowing graphs, holographic charts, and dynamic digital elements, conveying insight, analysis, and advanced technology in a sleek modern style.
Premium
Man look at the dashboard with graphs and charts. Concept of data management system, business intelligence, data statistics, marketing analysis, key performance indicators (KPI) and analytics.
Premium
Financial market data analysis with glowing 3D bar and line charts on dark background showing economic trends and growth concept visualization. 3D Rendering
Digital Interface Showing Data Processing with Vibrant Media Icons
Futuristic Digital Interface with Notification Banners and Binary Code
Financial Data Integration with 3D Cityscape and Graphs
World Map with Candlestick Charts and Financial Data Visualization
Futuristic Data Charts Over City Skyline at Night
Futuristic Digital Dashboard with Graphs and Analytics Interface
Global Finance and Data Technology Visualization
Futuristic Urban Analytics with Overlaid Graphs and Data Tags
Premium
Sustainability dashboard on tablet screen shows charts and graphs highlighting waste management and sustainability efforts with finger pointing to bar graph for data analysis
Premium
Hand pointing at glowing digital data analytics screen with charts and graphs
Digital Trading Dashboard with Candlestick Charts and Global Data
Digital Financial Dashboard Showing Possitive Market Analytics Trends
Digital Data Visualization Over Urban Skyline Concept
Futuristic Digital Interface with City Overlay and Data Graphs
Premium
AI data analytics dashboard, business data insights, AI-powered data analysis dashboard, business strategy, Analyst or Scientist uses a computer and dashboard for analysis of information development
Digital Dashboard Displaying Rising Follower Count with Data Analytics
Financial Data Visualization with Trend Analysis and Candlestick Bars
Digital Charts Over Night Cityscape Symbolizing Financial Analytics
Cybercrime and Data Breach Concept with Digital Padlock
Premium
Business colleagues discussing sales performance while reviewing charts and graphs on a computer screen, analyzing financial data in a modern office setting
Explore More Free Stock Images