
- Home >
- Stock Photos >
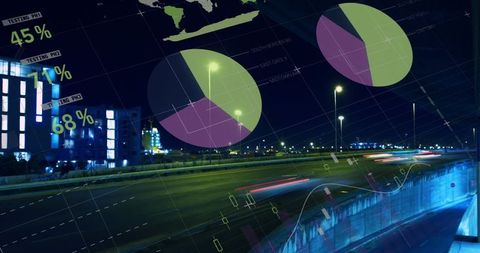
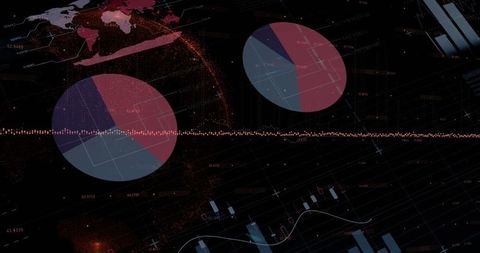
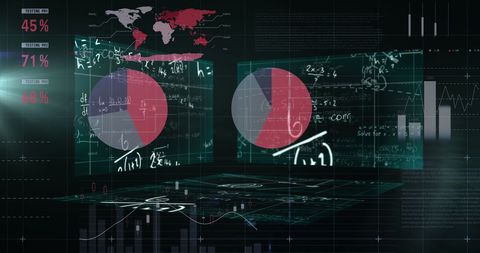
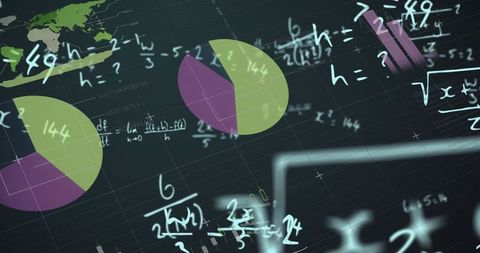
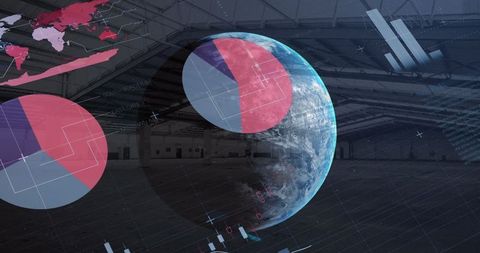
- Dynamic Digital Dashboard with Analytics and Visualizations
Dynamic Digital Dashboard with Analytics and Visualizations Image

This dynamic scene features a digital dashboard displaying various analytical tools, including pie charts, a world map heatmap, and candlestick charts. Mathematical equations reflect an advanced data-driven environment suited for technology and finance sectors. Ideal for illustrating data visualization, financial analysis, or digital transformation themes in presentations, marketing materials, and educational content about innovations in technology and finance. Enhance content with a focus on analytics or introduce concepts of digital integration.
Powered by 


downloads
Tags:
More
Credit Photo
If you would like to credit the Photo, here are some ways you can do so
Text Link
photo Link
<span class="text-link">
<span>
<a target="_blank" href=https://pikwizard.com/photo/dynamic-digital-dashboard-with-analytics-and-visualizations/0b55b67acac545ffe7a2c75878d55e4b/>PikWizard</a>
</span>
</span>
<span class="image-link">
<span
style="margin: 0 0 20px 0; display: inline-block; vertical-align: middle; width: 100%;"
>
<a
target="_blank"
href="https://pikwizard.com/photo/dynamic-digital-dashboard-with-analytics-and-visualizations/0b55b67acac545ffe7a2c75878d55e4b/"
style="text-decoration: none; font-size: 10px; margin: 0;"
>
<img src="https://pikwizard.com/pw/medium/0b55b67acac545ffe7a2c75878d55e4b.jpg" style="margin: 0; width: 100%;" alt="" />
<p style="font-size: 12px; margin: 0;">PikWizard</p>
</a>
</span>
</span>
Free (free of charge)
Free for personal and commercial use.
Author: Awesome Content
Similar Free Stock Images

Premium


Premium

Premium


Premium


Premium


Premium

Premium


Premium


Premium


Premium


Premium


Premium


Premium

Premium

Premium


Premium


Premium


Premium


Premium

Premium


Premium


Premium


Premium


Premium


Premium

Explore More Free Stock Images