- Home >
- Stock Photos >
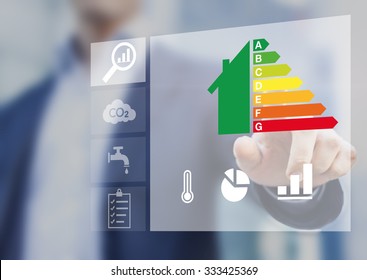
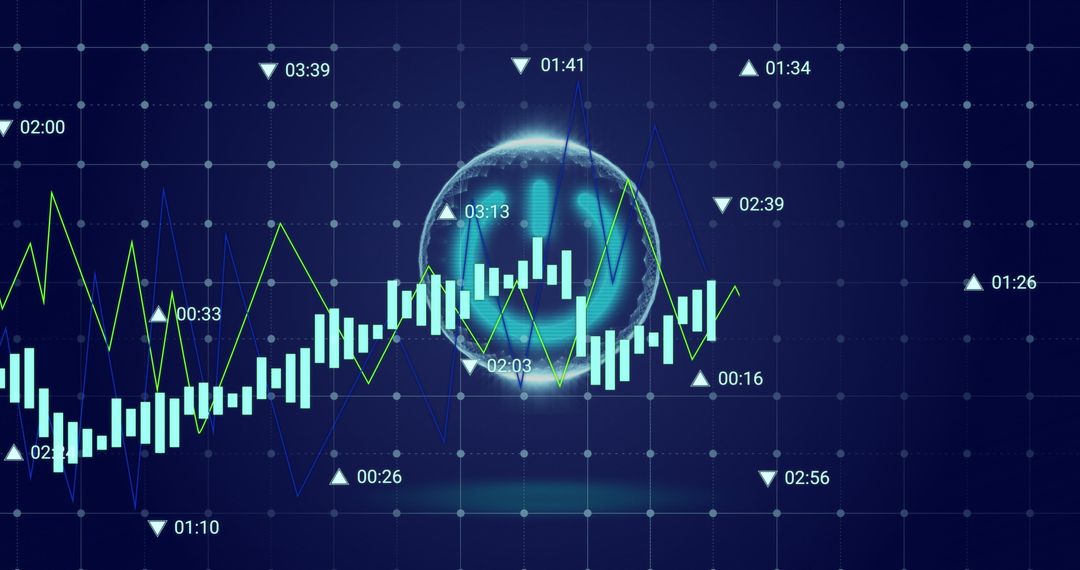
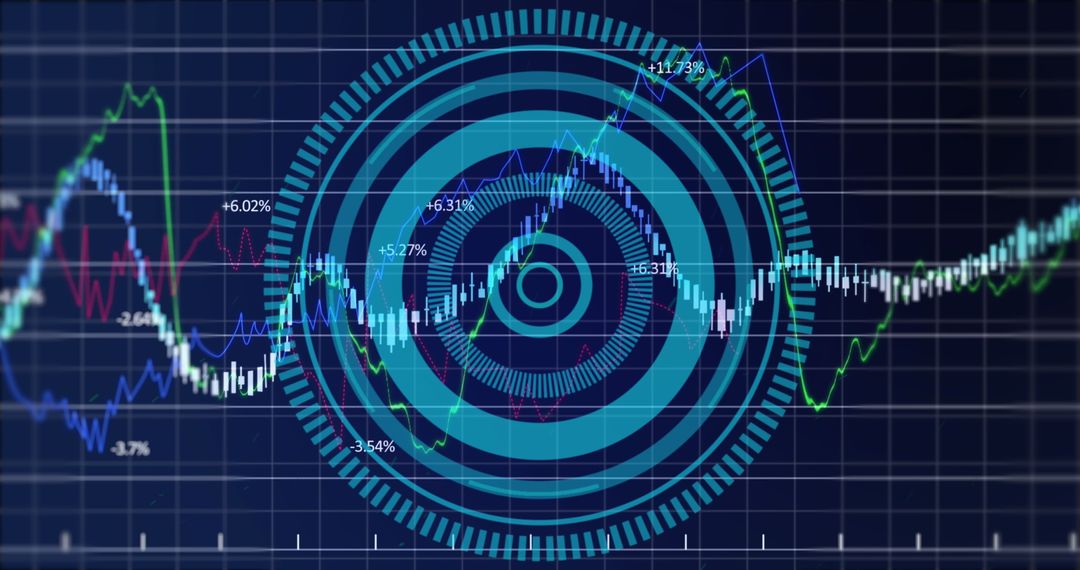
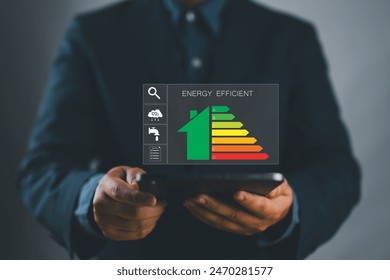
- Dynamic Digital Dashboard with Sustainable Energy Indicators
Dynamic Digital Dashboard with Sustainable Energy Indicators Image

Visually engaging scene showing an animated digital dashboard with various icons and graphs linked to sustainable energy. Concepts conveyed are progress and renewable energy advancements with statistical data included. Useful for presentations related to green technology, business growth reports, or educational materials on alternative energy solutions.
Powered by  - Get 15% off with code: PIKWIZARD15


8
downloads
downloads
Tags:
More
Credit Photo
If you would like to credit the Photo, here are some ways you can do so
Text Link
photo Link
<span class="text-link">
<span>
<a target="_blank" href=https://pikwizard.com/photo/dynamic-digital-dashboard-with-sustainable-energy-indicators/385974b6bb82c8fae9262a2cdbb2d655/>PikWizard</a>
</span>
</span>
<span class="image-link">
<span
style="margin: 0 0 20px 0; display: inline-block; vertical-align: middle; width: 100%;"
>
<a
target="_blank"
href="https://pikwizard.com/photo/dynamic-digital-dashboard-with-sustainable-energy-indicators/385974b6bb82c8fae9262a2cdbb2d655/"
style="text-decoration: none; font-size: 10px; margin: 0;"
>
<img src="https://pikwizard.com/pw/medium/385974b6bb82c8fae9262a2cdbb2d655.jpg" style="margin: 0; width: 100%;" alt="" />
<p style="font-size: 12px; margin: 0;">PikWizard</p>
</a>
</span>
</span>
Free (free of charge)
Free for personal and commercial use.
Author: Authentic Images
Similar Free Stock Images

Premium


Premium


Premium


Premium


Premium


Premium


Premium


Premium


Premium


Premium


Premium


Premium


Premium


Premium


Premium


Premium


Premium


Premium


Premium


Premium


Premium


Premium


Premium


Premium