
- Home >
- Stock Photos >
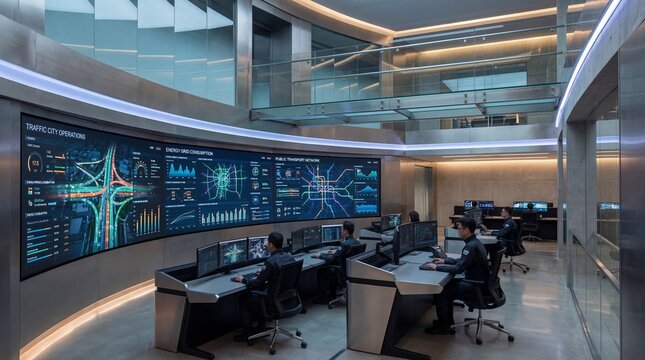
- Dynamic Digital Data Center with Changing Graphs and Analytics
Dynamic Digital Data Center with Changing Graphs and Analytics Image

In this abstract composition, the blue-toned image blends elements of data visualization and network security, showing multiple dynamic graphs. Overlapping chart lines suggest continuous data processing within a modern data center environment. This can be used effectively for presentations and publications related to technology, IT infrastructure, business analytics, and cybersecurity trends.
Powered by 


downloads
Tags:
More
Credit Photo
If you would like to credit the Photo, here are some ways you can do so
Text Link
photo Link
<span class="text-link">
<span>
<a target="_blank" href=https://pikwizard.com/photo/dynamic-digital-data-center-with-changing-graphs-and-analytics/7d9ee7096b91918ea3ff913eb7971f8b/>PikWizard</a>
</span>
</span>
<span class="image-link">
<span
style="margin: 0 0 20px 0; display: inline-block; vertical-align: middle; width: 100%;"
>
<a
target="_blank"
href="https://pikwizard.com/photo/dynamic-digital-data-center-with-changing-graphs-and-analytics/7d9ee7096b91918ea3ff913eb7971f8b/"
style="text-decoration: none; font-size: 10px; margin: 0;"
>
<img src="https://pikwizard.com/pw/medium/7d9ee7096b91918ea3ff913eb7971f8b.jpg" style="margin: 0; width: 100%;" alt="" />
<p style="font-size: 12px; margin: 0;">PikWizard</p>
</a>
</span>
</span>
Free (free of charge)
Free for personal and commercial use.
Author: Authentic Images
Similar Free Stock Images

Premium


Premium

Premium


Premium


Premium


Premium


Premium

Premium

Premium

Premium


Premium


Premium


Premium


Premium


Premium

Premium

Premium


Premium


Premium


Premium


Premium


Premium

Premium


Premium


Premium


Explore More Free Stock Images