1. Home > 
  2. Stock Photos > 
  3. Dynamic Digital Data Display with Vibrant Graphs

Dynamic Digital Data Display with Vibrant Graphs Image

Dynamic Digital Data Display with Vibrant Graphs

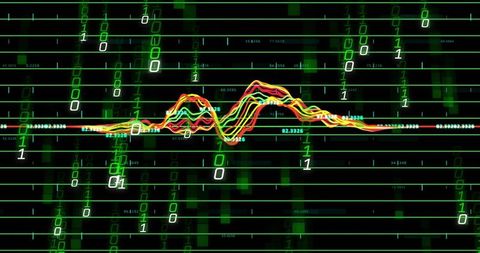
Conceptual image depicting dynamic data visualization with vivid graphs on a digital screen, making it ideal for illustrating topics related to global business, finance, economy, and data analytics. Suitable for use in presentations, reports, and articles highlighting technological advancements and analytical concepts.

Powered by Shutterstock logo - Get 15% off with code: PIKWIZARD15
Medicine doctor hand working with modern computer interface as medical concept - Powered by Shutterstock - Get 15% off with code: PIKWIZARD15Data analytics automated with AI technology. Big data, business analytics and artificial intelligence automation. Dashboard report with sales and operations charts and KPI insights on touch screen. - Powered by Shutterstock - Get 15% off with code: PIKWIZARD15Shot of a Desktop Computer in the Creative Modern Office. Monitor Screen Shows Company Growth Data with Graphs, Charts, Software UI. In the Background Young Professional Using Smartphone. - Powered by Shutterstock - Get 15% off with code: PIKWIZARD15Company Operations Manager Holds Meeting Presentation. Diverse Team Uses TV Screen with Growth Analysis, Charts, Statistics and Data. People Work in Business Office. - Powered by Shutterstock - Get 15% off with code: PIKWIZARD15Man look at the dashboard with graphs and charts. Concept of data management system, business intelligence, data statistics, marketing analysis, key performance indicators (KPI) and analytics. - Powered by Shutterstock - Get 15% off with code: PIKWIZARD15

Credit Photo

If you would like to credit the Photo, here are some ways you can do so

Free (free of charge)

Free for personal and commercial use.

Author: People Creations

Similar Free Stock Images

Colorful Lines Representing Stock Market Trends on Digital Screen
Premium
Stockmarket online trading chart candlestick on crypto currency platform. Stock exchange financial market price candles graph data pattern analysis concept. Computer screen closeup background
Dynamic Financial Market Graph Amidst Digital Equations
Abstract Data Analysis Overlay on Coastal Landscape
Dynamic Green Stock Chart on Digital Grid Background
Abstract Data and Technology with Business Facilitator
Premium
Data analyst working on business analytics dashboard with charts, metrics and KPI to analyze performance and create insight reports for operations management.
Abstract Network Visualization with Woman's Profile and Digital Data
Futuristic Digital Data Processing and Analysis Concept
Digital Data Visualization with Futuristic Infographics
Dynamic Data Analysis over Virtual Grid with Neural Patterns
Premium
Financial stock exchange market display screen board on the street, selective focus
Digital Data Visualization Over World Map in Network Concept
Financial Data and Network Connections Over Black Background
Glowing Data Graph Overlay on Spinning Black Globe
Dynamic Financial Data Charts in Modern Office Background
Premium
Online trading, Investment, Strategy market plan, and Stock mark
Global Financial Technology Network and Data Analytics
Futuristic Data Analytics with Virtual Graph over Digital Grid
Data Trends Overlayed on Cityscape Skyscrapers
Neon Tunnel Visualizing Dynamic Data in Futuristic Interface
Premium
Two Digital Computer Screens with Financial Analytical Data in Modern Monitoring Office. Control Room with Finance Specialists Sit in Front of Computers.
Futuristic Digital Interface for Autonomy and Networking
Abstract Stock Market Graph with Digital Data Animation
Abstract Digital Data Visualization with Colorful Graphs
Dynamic Stock Market Data Visualization for Financial Analysis
Premium
Medicine doctor hand working with modern computer interface as concept
Global Data Analysis on Digital Interface World Map
Digital Network Data Streams with Glowing Green Connections
Animated Waveform and Icons on Digital Interface for Analytics
Innovative Digital Analysis Waveform with Futuristic Interface
Dynamic Stock Market Chart with Colorful Trend Lines
Dynamic Stock Market Graph Display on Digital Grid
Premium
Transparent futuristic tablet. Business man using virtual touch screen. Modern mobile technology in accounting, finance, data and analytics. Internet of things (IOT) and augmented reality concept.
Futuristic Data Visualization Oscillation Concept
Dynamic Stock Market Data Visualization on Digital Screen
Financial Graph Overlaying Retail Store Backdrop Visualizing Market Trends
Dynamic Multicolored Graphs on Abstract Digital Finance Background
Premium
Businessman hand touching with finger virtual panel with infographs
Financial Data Visualization and Digital Analysis Concept
Abstract Financial Graphs with Rising Trends and Positive Indicators
Financial Data Visualization in Server Room Setting
Cybernetic Data Flow with Digital Network Connections
Premium
Business man trader investor analyst using mobile phone app analytics for cryptocurrency financial market analysis, trading data index chart graph on smartphone and laptop screen. Over shoulder view
Digital Network Connections and Financial Data Analysis
Dynamic Financial Data Displayed on Neon Graphs
Dynamic Data Processing with Digital Interfaces in Motion
Abstract Data Visualization with Digital Interface Overlays
Premium
Woman hold smartphone use pc at workplace. Project stats financial data sales charts on laptop and cellphone screen, close up view over shoulder. Report preparation, synchronization for safety concept
Abstract Digital Network with Colorful Data Lines and Shapes
Dynamic Neon Lines with Data Streams Over Digital Grid
Soundwave Visualization and Data Analysis on Digital Grid
Digital Data Streams with Abstract Purple Wave Background
Premium
Data science, business analysis and strategy, big data concept.Business teamwork analyzing financial graph on virtual touch screen, futuristic technology solution for business development
Dynamic Display of Financial Market Data on Advanced Grid
Financial Data Visualization on World Map with Graph Analytics
Digital Data Processing and Global Connectivity Illustrated
Futuristic Data Map With Multi-Color Graph Lines
Premium
Medical technology and futuristic concept.Digital healthcare and network on modern virtual screen.Health Check with digital system support for patient with medical icon at hospital.Global health care.
Futuristic Digital Data Network with Analytics Overlay
Colorful Digital Waveform with Analytical Overlay and Red Grid Lines
Digital Analytics Dashboard with Gray Vertical Bars and Line Graphs
Dynamic Stock Market Concept with Colorful Line Graphs
Colorful Stock Market Graph on Dark Grid Background Illustrating Global Economy Trends
Dynamic Financial Data Over Abstract Background
Premium
Businessman press on digital screen, digital layer effect, business strategy concept
Dynamic Financial Data Display Over Global Stock Market
Diverse Data and Graphs on Digital Screen for Global Business Concepts
Dynamic Data Flow with Analytics Visuals on Grid
Abstract Financial Data Visualization with Light Bokeh
Premium
Businessman analyzing forex trading graph financial data. Business finance background.business finance technology and investment concept. Stock Market Investments Funds and Digital Assets.
Dynamic Financial Graphs Illustrating Market Trends and Data
Digital Finance Data Overload with Code and Graphs
Digital Financial Graph and Programming Concepts
Dynamic Financial Data Analyzing with Graph Overlays
Premium
Data analyst working on business analytics dashboard with charts, metrics and KPI to analyze performance and create insight reports and strategic decisions for operations management on virtual screen.
Financial Data Overlaid on City Skyline
Dynamic Data Processing Concept in Digital Interface Design
Futuristic Data Graph with Digital Interface Elements
Futuristic Data Analysis Overlaying Cityscape Digital Interface
Premium
Multi-Ethnic Office Conference Room. Indian CEO does Presentation for Diverse Young Entrepreneurs, Talking, Using TV with Infographics, Statistics, Graphs. Businesspeople Invest in e-Commerce Startup
Abstract Neon Data Tunnel with Dynamic Numbers Overlay
Abstract Financial Data Interface with Dynamic Chart Lines
Digital Abstract Triangles and Lines on Purple Background
Dynamic Data Graph on Dark Digital Grid Background
Premium
Business people using website or AI software technology analyze data and big data technology. business analysis and display images of complex data sets on a computer on the screen. artificial
Digital Interface with Data Processing and Security Elements
Abstract Digital Data Processing with Visual Firewall Concept
Abstract Data Wave Patterns on Technology Interface
Abstract Digital Data and Network Connections Background
Premium
businessman working with data and graphs in spreadsheet documents for online analysis Microsoft Excel project dashboard accounting digital
Abstract Neon Waveforms on Digital Grid Layout
Neon waveform bundle oscillating across futuristic digital dashboard with grid and data markers
Colorful Stock Market Graph Displaying Economic Trends
Colorful Stock Market Graph with Data on Grid
Futuristic Financial Graphs with Dynamic Green Line
Dynamic Financial Data Streams for Market Analysis
Premium
Stock graph and financial chart. Analyze stock market finance volume of stock market with Graph and chart holograph technology. High quality photo
Futuristic Digital Data Analysis with Vibrant Graphs
Digital Interface with Graphs and Data Lines in Cyber Space
Dynamic Data Processing with Colorful Visual Analytics Interface
Interactive Financial Data Analysis with Digital Technology
Premium
Businessman analyzing forex trading graph financial data. Stock Market Investments Funds and Digital Assets. Business finance technology and investment concept. Business finance background.
Digital Data Processing on Interconnected Network
Abstract Financial Data Visualization with Multicolored Graphs
Financial Data Visualization with Network of Connections
Abstract Network Connections with Financial Data Overlay
Premium
Female Analyst at Her Desk Works on a Laptop Showing Statistics, Graphs and Charts. She Works on the Wooden Table in Creative Office. Over the Shoulder Footage.
Digital Financial Graphs and Market Data Analysis
Dynamic Data and Graphs on Digital Screen
Complex Digital Financial Data on Grid
Abstract Financial Data Streams Over Cityscape Background
Premium
Female Software Engineer Working in a Modern Monitoring Office with Live Analysis Feed with Charts on a Big Digital Screen. Monitoring Room Big Data Scientists and Managers Sit in Front of Computers.
Dynamic Stock Market Graph on Digital Interface
Financial Data and Stock Market Trends Overlaying Cityscape
Financial Market Data Visualization with Global Chart Overlay
Abstract Robotic Arm Analyzing Digital Financial Graphs for AI-Based Trading
Premium
Data analytics automated with AI technology. Businessman use laptop and dashboard for Automating Data Management Analytics and Business Reports with KPI. AI chat bot. Database. Sales. Marketing.
Abstract Financial Data Processing and Analysis Interface
Global Financial Data with Dynamic Analytics Visualization
Digital Finance Graph with Data Points on Dark Background
Futuristic Neon Waveform on Digital Screen
Premium
Office Conference Room Meeting: Digital Enterpreneur Presents e-Commerce Investment Strategy for Group of Investors. Wall TV Showing Big Data Analysis, Infographics, Stock Market Information, Trends
Neon Binary Waveform Dashboard Visualizing Real-Time Data Stream and Signal Patterns