- Home >
- Stock Photos >
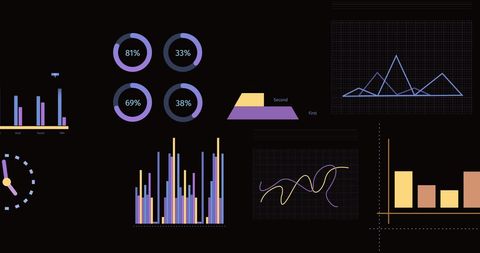
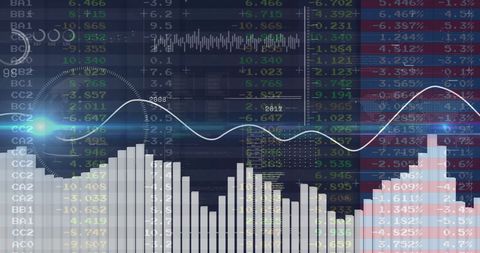
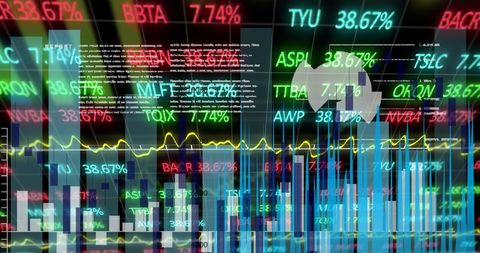
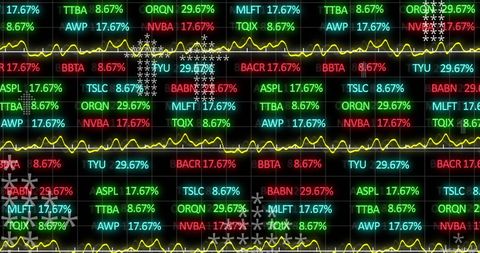
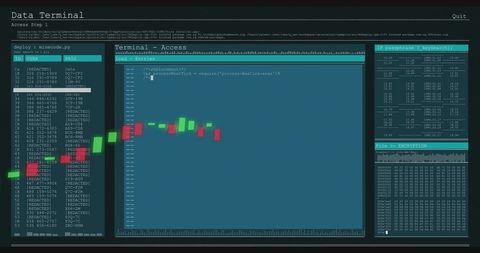
- Dynamic Digital Data Processing and Analysis Graphs
Dynamic Digital Data Processing and Analysis Graphs Image

Various colorful digital charts and graphs displaying complex data analytics and financial information. Ideal for use in presentations related to big data, technology innovations, financial markets, as well as academic contexts focused on data analysis and graphs.

downloads
Tags:
More
Credit Photo
If you would like to credit the Photo, here are some ways you can do so
Text Link
photo Link
<span class="text-link">
<span>
<a target="_blank" href=https://pikwizard.com/photo/dynamic-digital-data-processing-and-analysis-graphs/25e15999efcd261cdb4f6472f33fdda1/>PikWizard</a>
</span>
</span>
<span class="image-link">
<span
style="margin: 0 0 20px 0; display: inline-block; vertical-align: middle; width: 100%;"
>
<a
target="_blank"
href="https://pikwizard.com/photo/dynamic-digital-data-processing-and-analysis-graphs/25e15999efcd261cdb4f6472f33fdda1/"
style="text-decoration: none; font-size: 10px; margin: 0;"
>
<img src="https://pikwizard.com/pw/medium/25e15999efcd261cdb4f6472f33fdda1.jpg" style="margin: 0; width: 100%;" alt="" />
<p style="font-size: 12px; margin: 0;">PikWizard</p>
</a>
</span>
</span>
Free (free of charge)
Free for personal and commercial use.
Author: Creative Art