
- Home >
- Stock Photos >
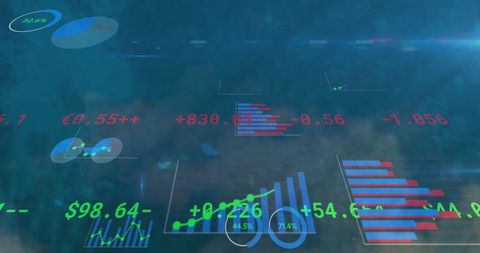
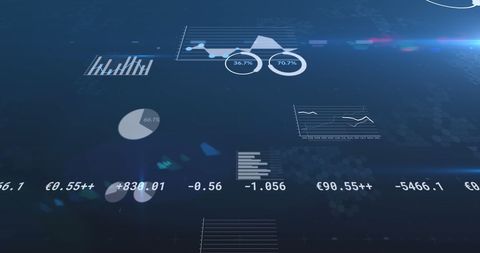
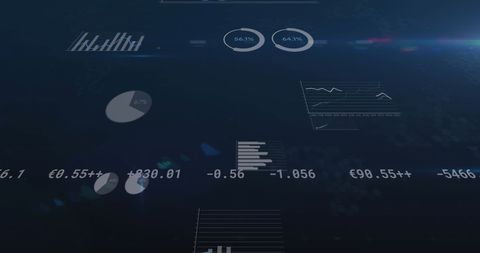
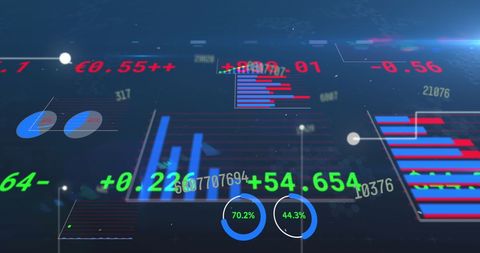
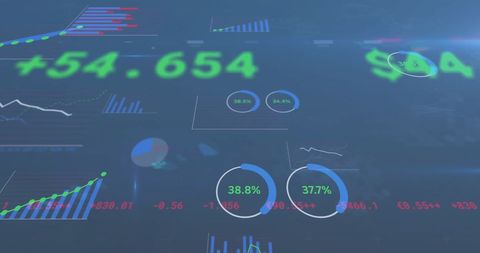
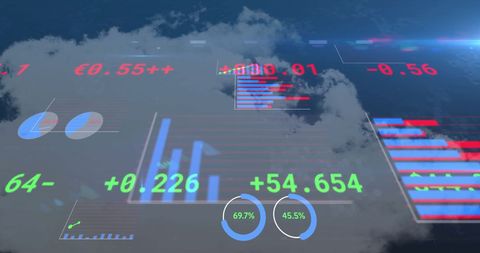
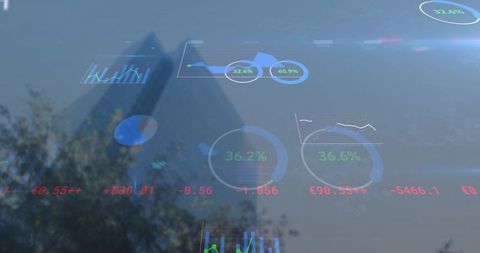
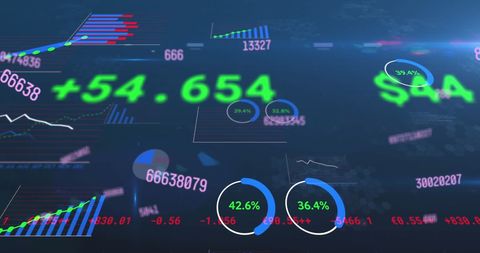
- Dynamic Digital Data Screen with Financial Graphs
Dynamic Digital Data Screen with Financial Graphs Image

Financial data and graphs are floating on a digital screen, featuring numbers and charts in red and green over a blue backdrop. This visual essentializes concepts of global business, technology-driven market analysis, economic trends, and modern finance management. Suitable for illustrating articles or reports discussing stock markets, digital finance systems, or economic forecasts.
Powered by 


downloads
Tags:
More
Credit Photo
If you would like to credit the Photo, here are some ways you can do so
Text Link
photo Link
<span class="text-link">
<span>
<a target="_blank" href=https://pikwizard.com/photo/dynamic-digital-data-screen-with-financial-graphs/5b14ceb78512205b284e48b76880e5f0/>PikWizard</a>
</span>
</span>
<span class="image-link">
<span
style="margin: 0 0 20px 0; display: inline-block; vertical-align: middle; width: 100%;"
>
<a
target="_blank"
href="https://pikwizard.com/photo/dynamic-digital-data-screen-with-financial-graphs/5b14ceb78512205b284e48b76880e5f0/"
style="text-decoration: none; font-size: 10px; margin: 0;"
>
<img src="https://pikwizard.com/pw/medium/5b14ceb78512205b284e48b76880e5f0.jpg" style="margin: 0; width: 100%;" alt="" />
<p style="font-size: 12px; margin: 0;">PikWizard</p>
</a>
</span>
</span>
Free (free of charge)
Free for personal and commercial use.
Author: Awesome Content
Similar Free Stock Images

Premium


Premium


Premium


Premium


Premium


Premium

Premium

Premium


Premium


Premium


Premium


Premium


Premium

Premium

Premium


Premium


Premium

Premium


Premium


Premium


Premium


Premium


Premium


Premium


Premium


Explore More Free Stock Images