
- Home >
- Stock Photos >
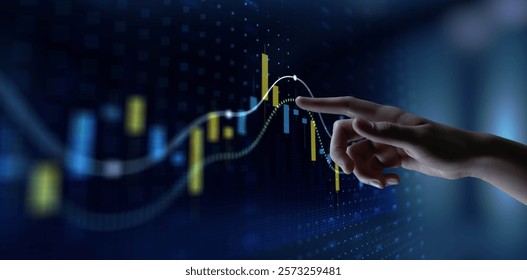
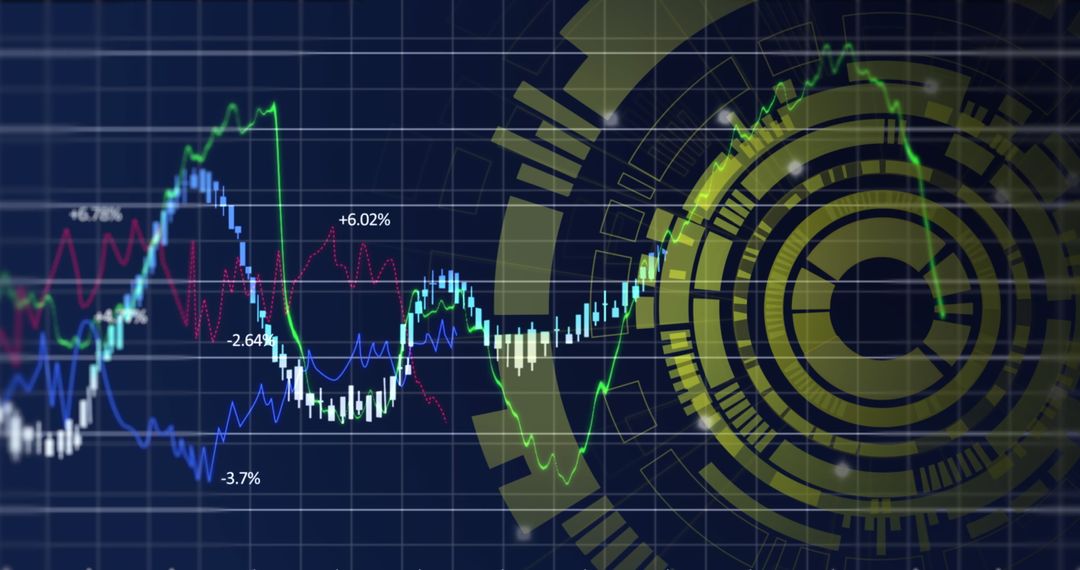
- Dynamic Digital Display of Financial Data
Dynamic Digital Display of Financial Data Image

Displaying overlapping trend lines and candlestick bars, this visualization encapsulates complex financial data, making it ideal for presentations in financial analysis, investment advisory, and digital technology educational materials. Figures like percentages signify recent stock performance changes, enhancing its relevance for users interested in stock market dynamics.
Powered by  - Get 15% off with code: PIKWIZARD15


0
downloads
downloads
Tags:
More
Credit Photo
If you would like to credit the Photo, here are some ways you can do so
Text Link
photo Link
<span class="text-link">
<span>
<a target="_blank" href=https://pikwizard.com/photo/dynamic-digital-display-of-financial-data/c20aed81be07675537f94d52bcea8401/>PikWizard</a>
</span>
</span>
<span class="image-link">
<span
style="margin: 0 0 20px 0; display: inline-block; vertical-align: middle; width: 100%;"
>
<a
target="_blank"
href="https://pikwizard.com/photo/dynamic-digital-display-of-financial-data/c20aed81be07675537f94d52bcea8401/"
style="text-decoration: none; font-size: 10px; margin: 0;"
>
<img src="https://pikwizard.com/pw/medium/c20aed81be07675537f94d52bcea8401.jpg" style="margin: 0; width: 100%;" alt="" />
<p style="font-size: 12px; margin: 0;">PikWizard</p>
</a>
</span>
</span>
Free (free of charge)
Free for personal and commercial use.
Author: Awesome Content
Similar Free Stock Images

Premium


Premium


Premium


Premium


Premium


Premium


Premium


Premium


Premium


Premium


Premium


Premium


Premium


Premium


Premium


Premium


Premium


Premium


Premium


Premium


Premium


Premium


Premium


Premium

