- Home >
- Stock Photos >
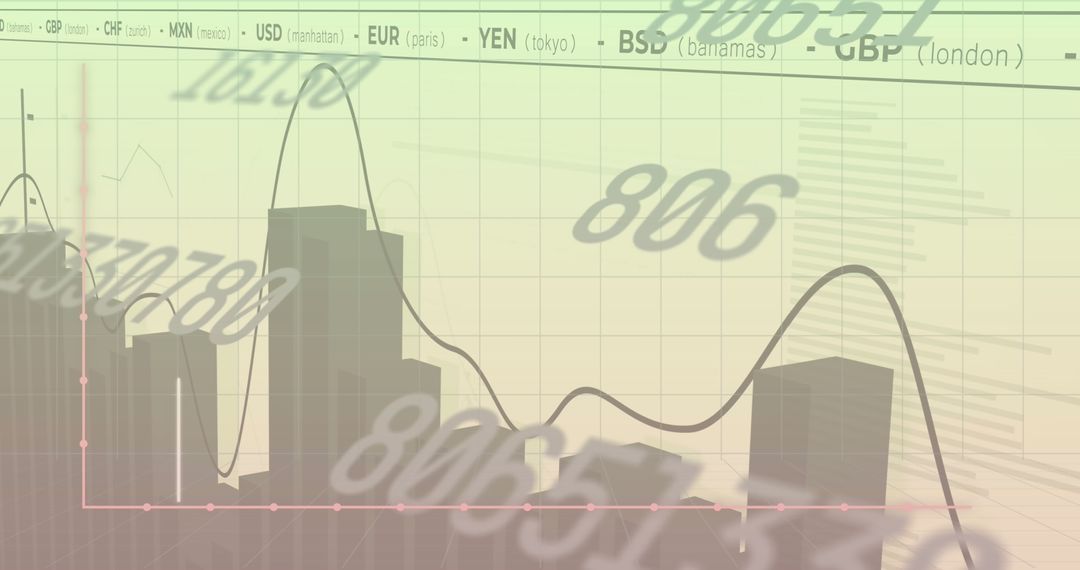
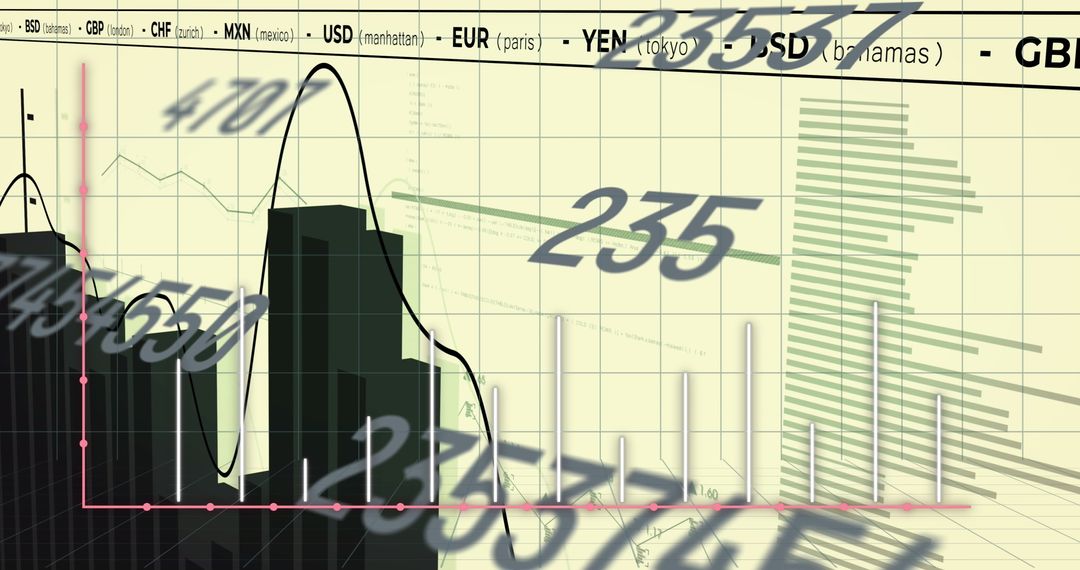
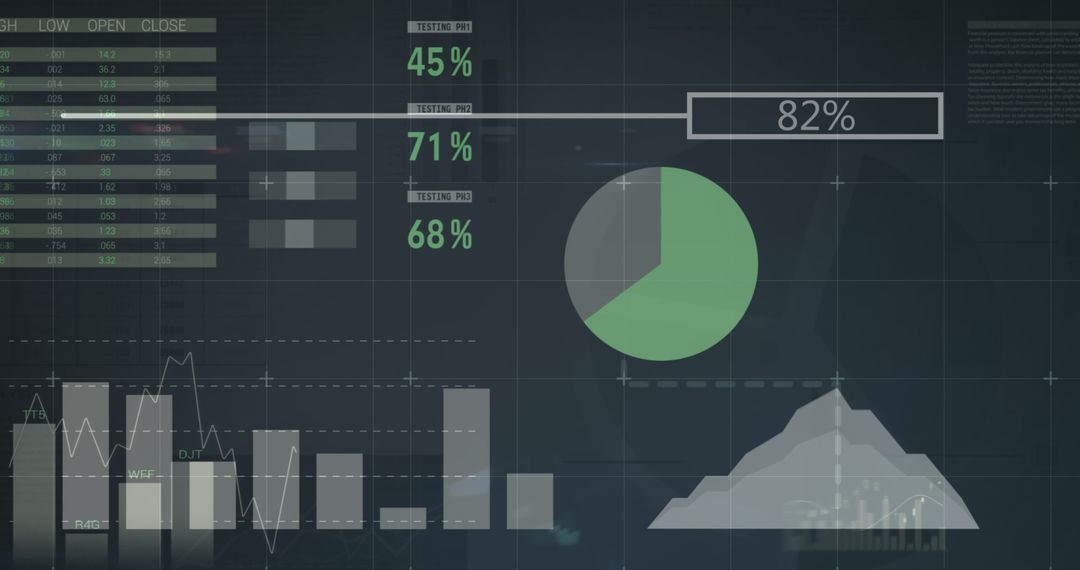
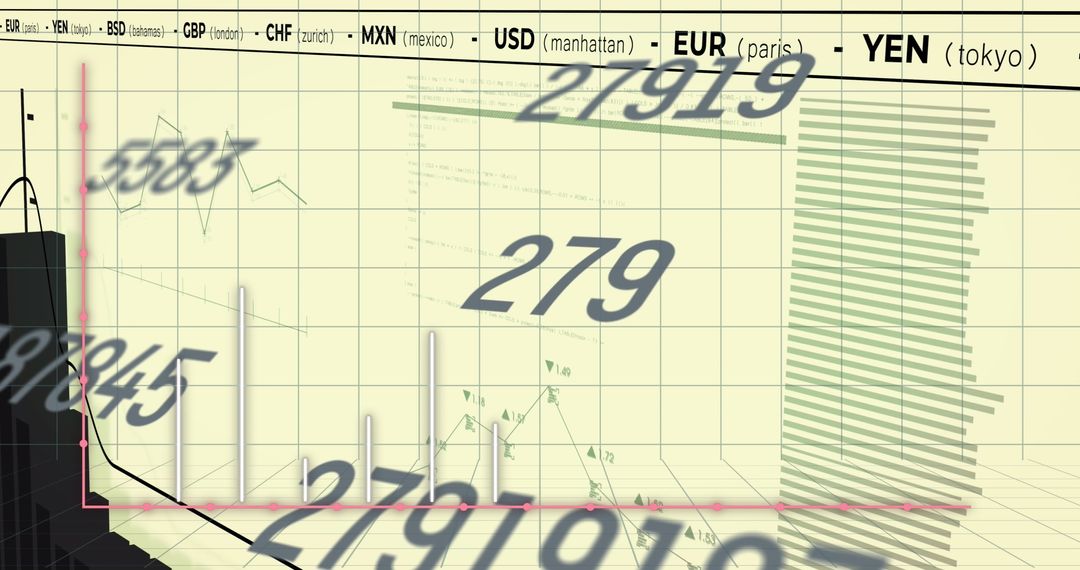
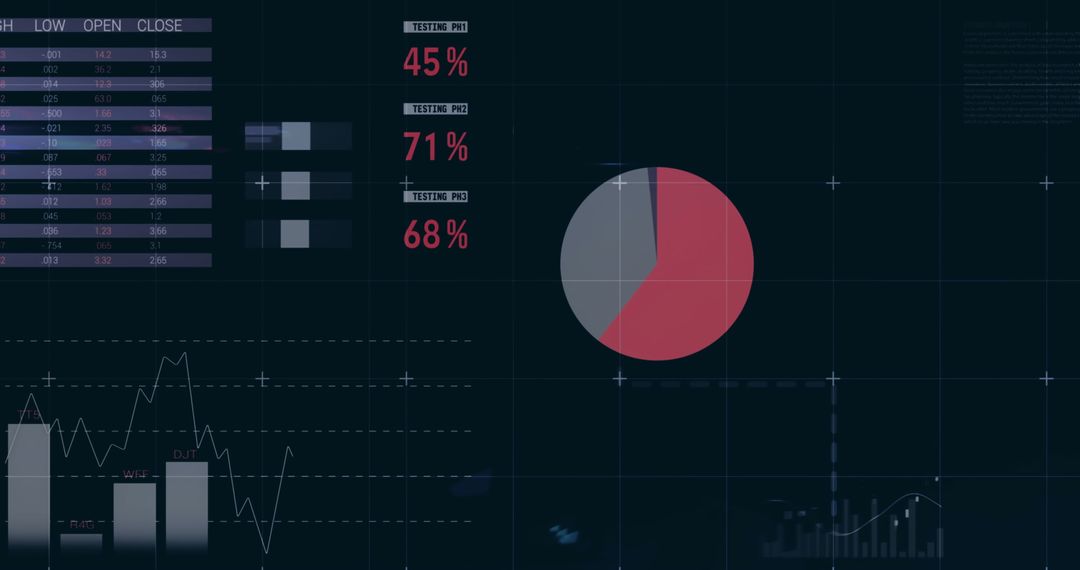
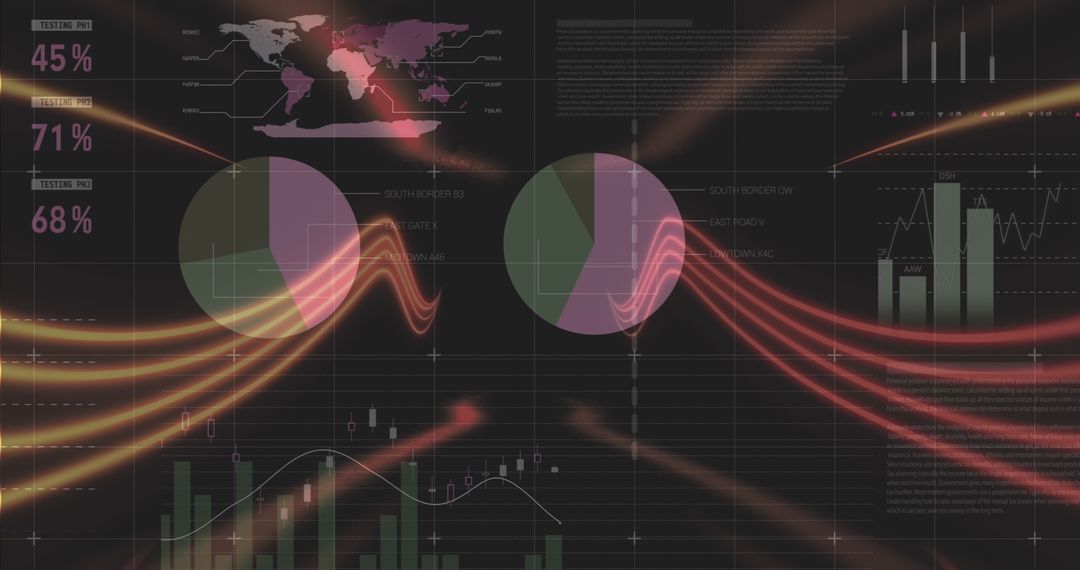
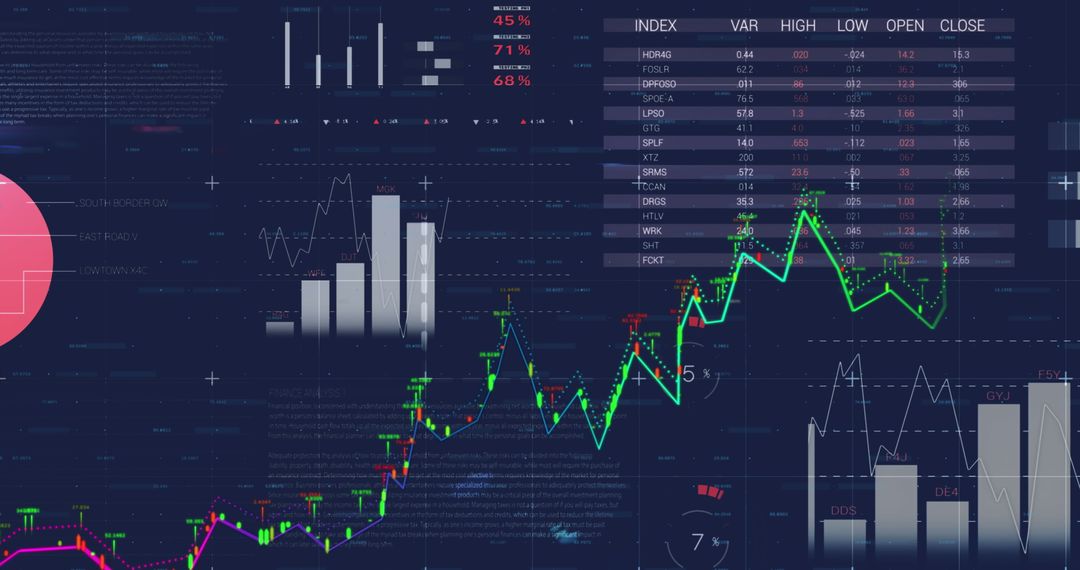
- Dynamic Digital Display of Stock Market Data Over Pink Background
Dynamic Digital Display of Stock Market Data Over Pink Background Image

This abstract representation of fluctuating economic numbers over a pink background illustrates the dynamic nature of global stock markets. Statistical charts in various levels of transparency offer insights into financial and technological themes. Ideal for business presentations, finance articles, and educational purposes centered on market analysis and economic trends.
Powered by 


2
downloads
downloads
Tags:
More
Credit Photo
If you would like to credit the Photo, here are some ways you can do so
Text Link
photo Link
<span class="text-link">
<span>
<a target="_blank" href=https://pikwizard.com/photo/dynamic-digital-display-of-stock-market-data-over-pink-background/731f0de35413ee75b08bb48460b31a8b/>PikWizard</a>
</span>
</span>
<span class="image-link">
<span
style="margin: 0 0 20px 0; display: inline-block; vertical-align: middle; width: 100%;"
>
<a
target="_blank"
href="https://pikwizard.com/photo/dynamic-digital-display-of-stock-market-data-over-pink-background/731f0de35413ee75b08bb48460b31a8b/"
style="text-decoration: none; font-size: 10px; margin: 0;"
>
<img src="https://pikwizard.com/pw/medium/731f0de35413ee75b08bb48460b31a8b.jpg" style="margin: 0; width: 100%;" alt="" />
<p style="font-size: 12px; margin: 0;">PikWizard</p>
</a>
</span>
</span>
Free (free of charge)
Free for personal and commercial use.
Author: Authentic Images
Similar Free Stock Images

Premium


Premium


Premium


Premium


Premium


Premium


Premium


Premium


Premium


Premium


Premium


Premium


Premium


Premium


Premium


Premium


Premium


Premium


Premium


Premium


Premium


Premium


Premium


Premium