- Home >
- Stock Photos >
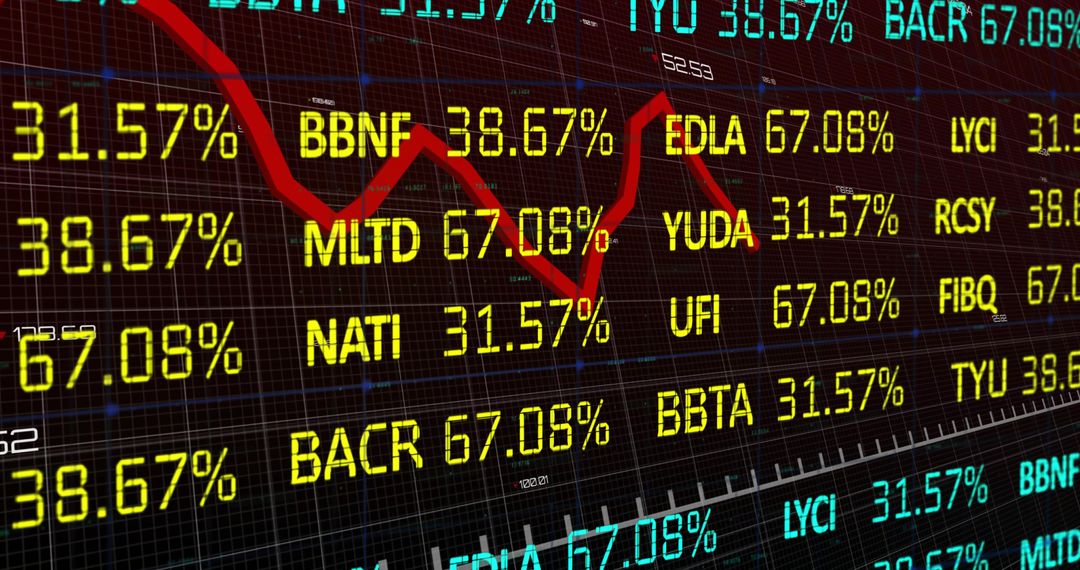
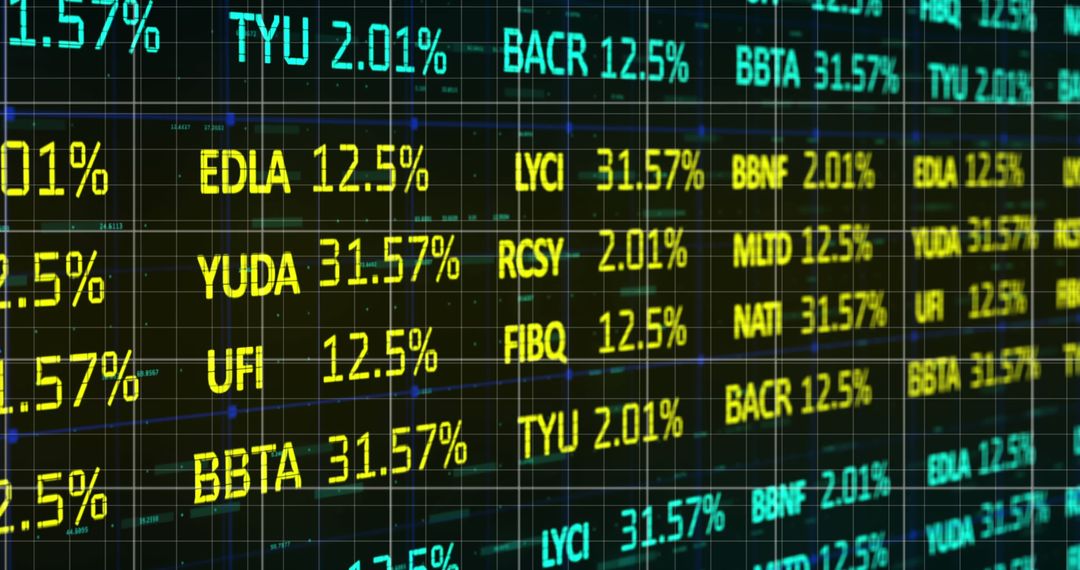
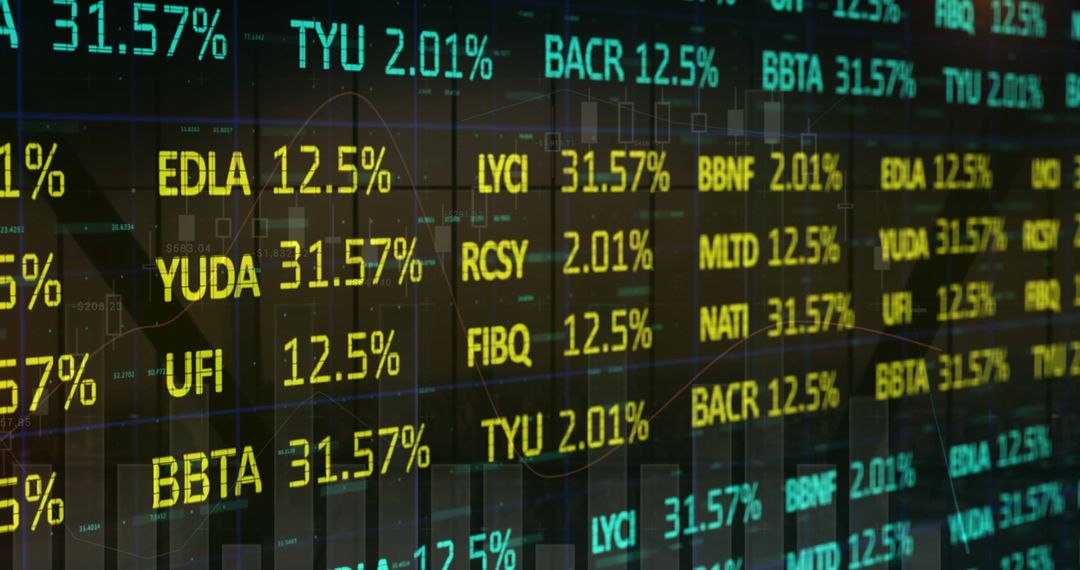
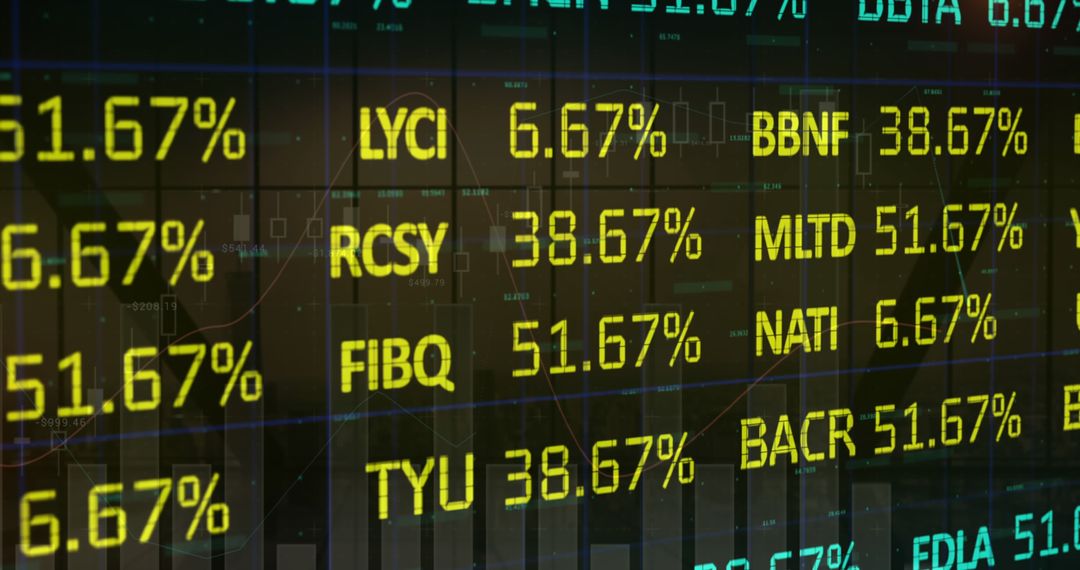
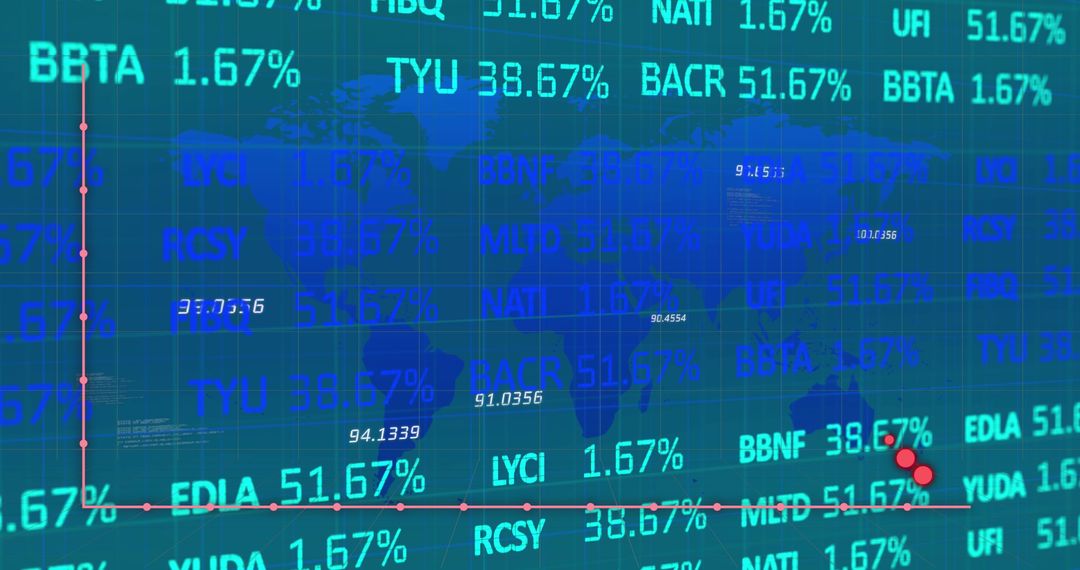
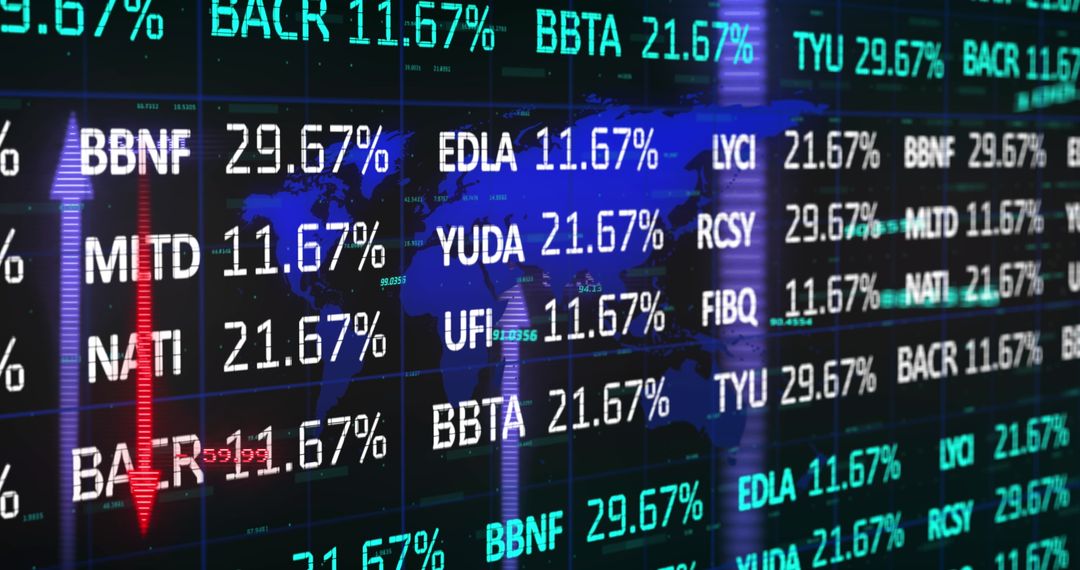
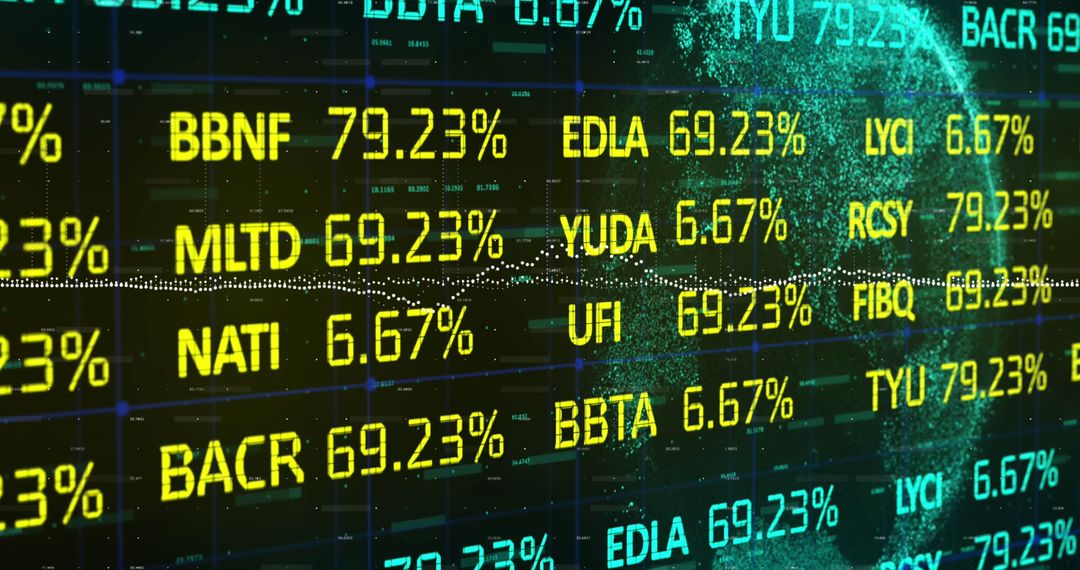
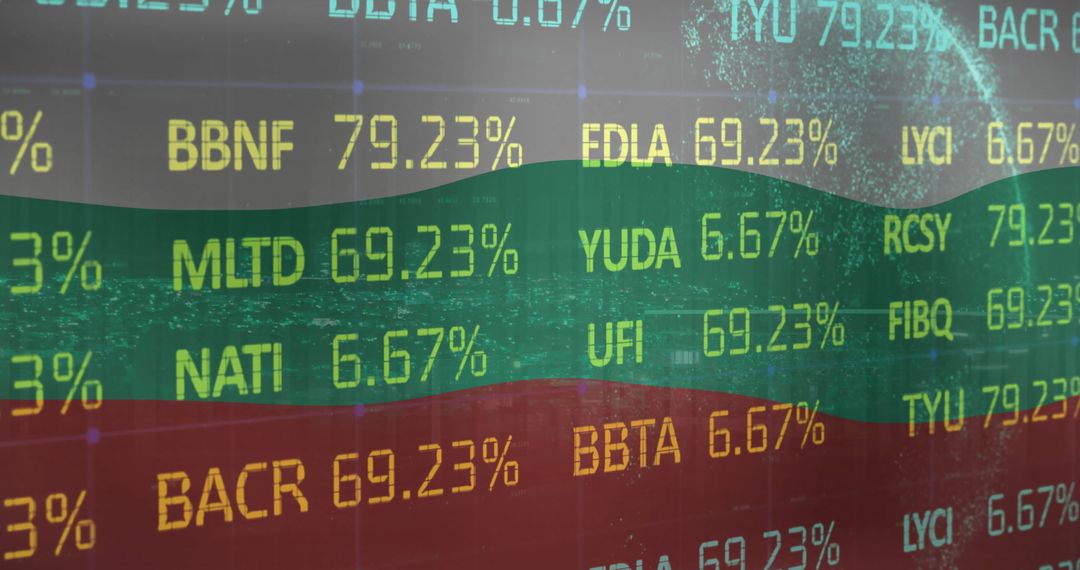
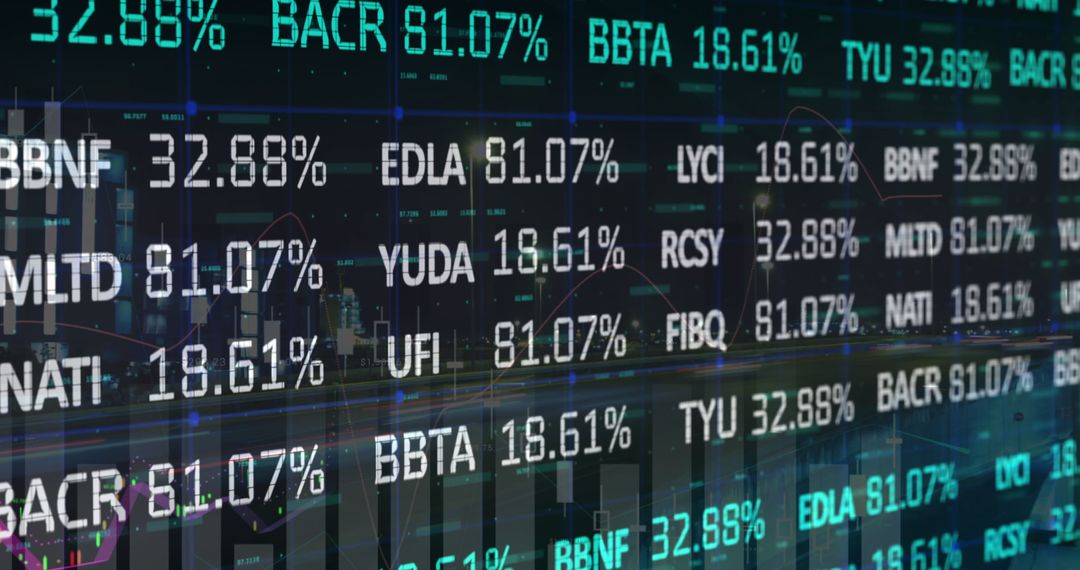
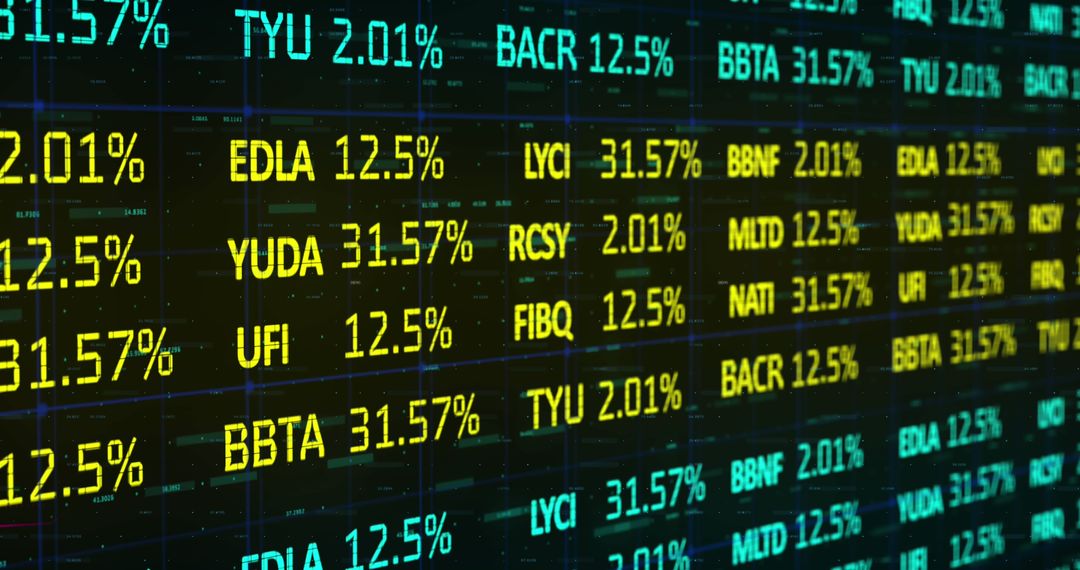
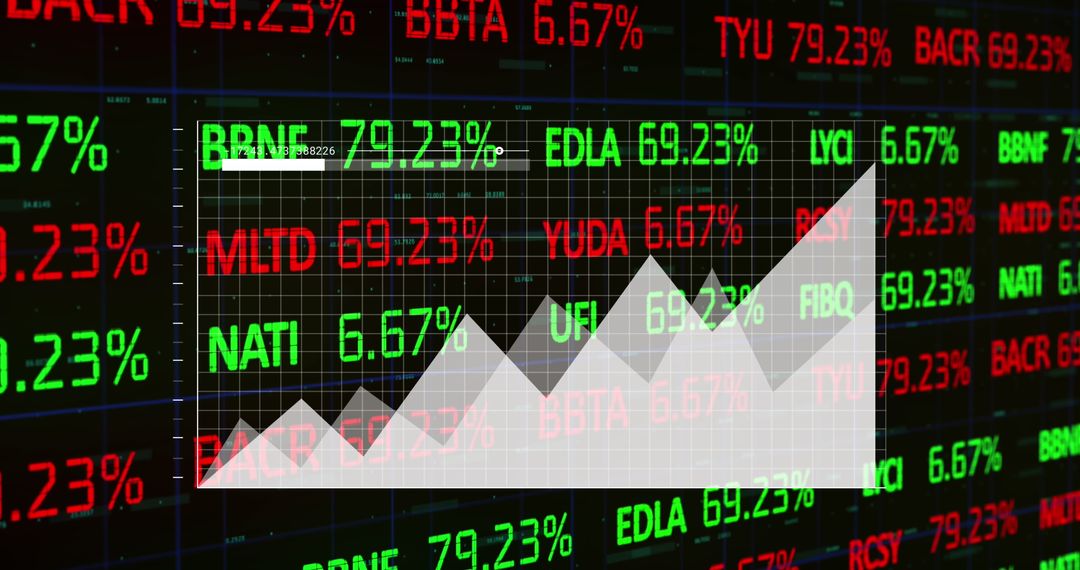
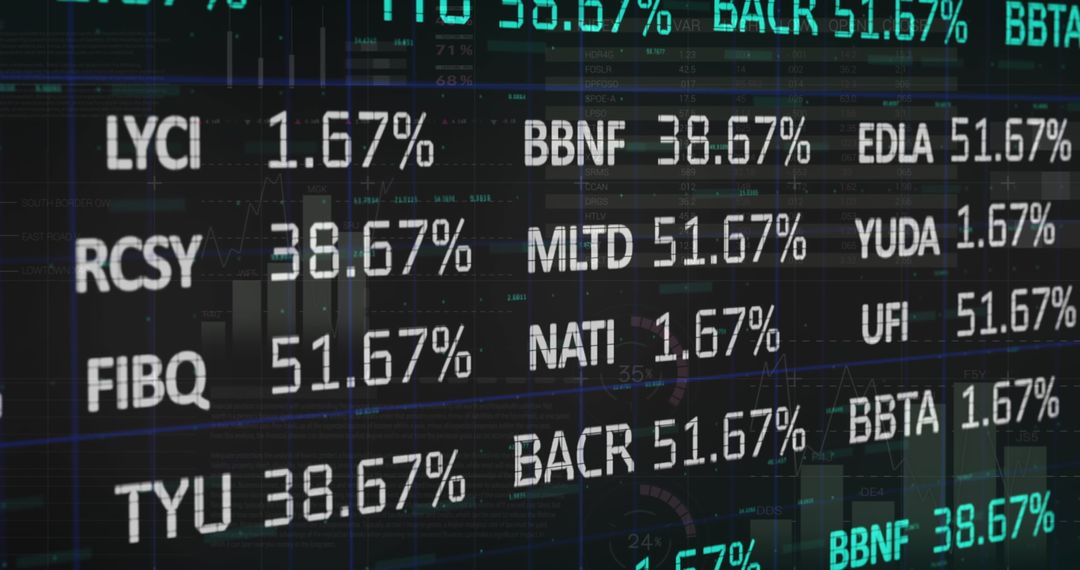
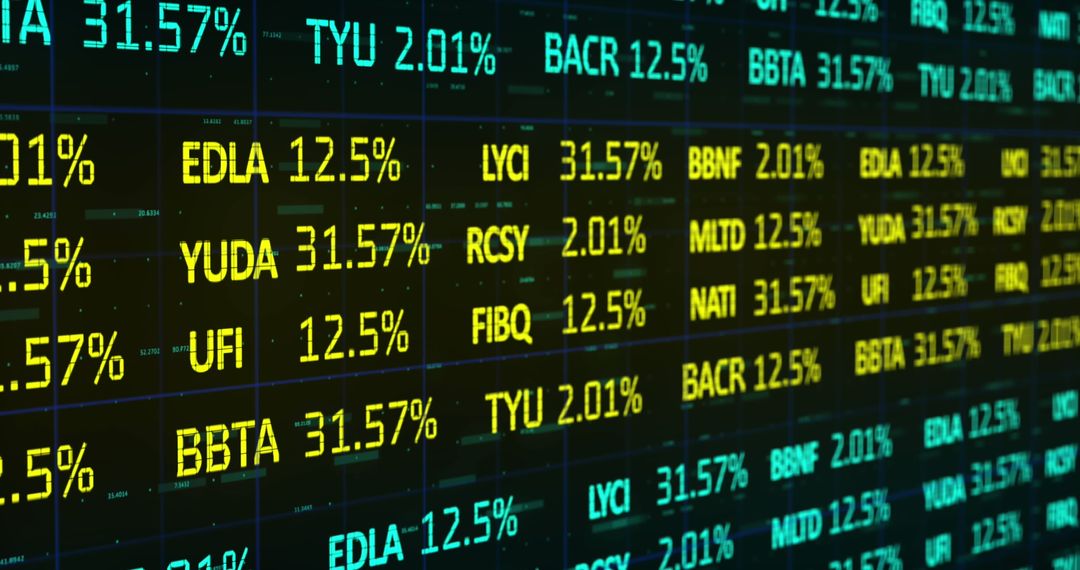
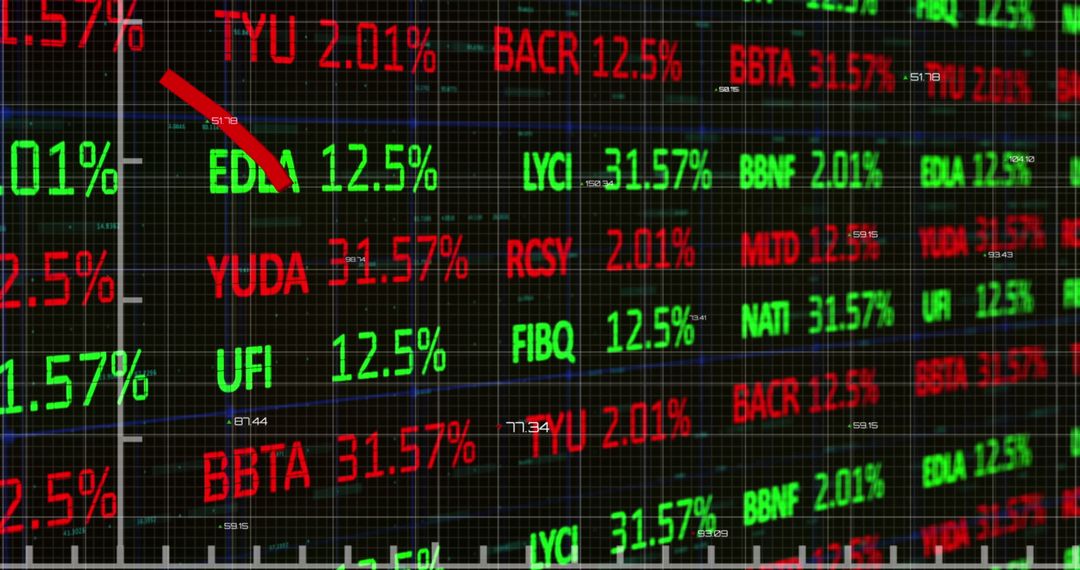
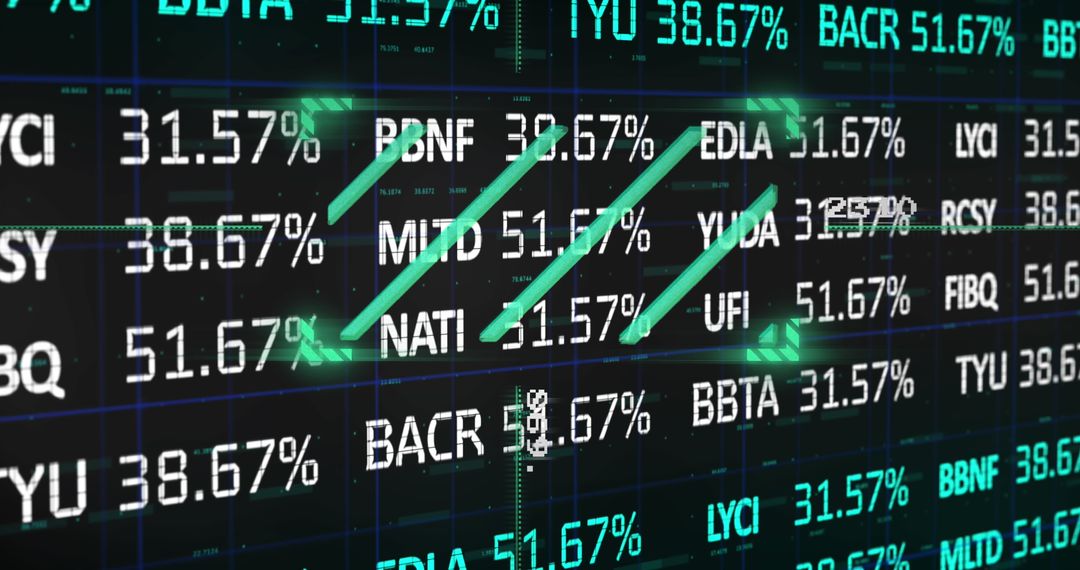
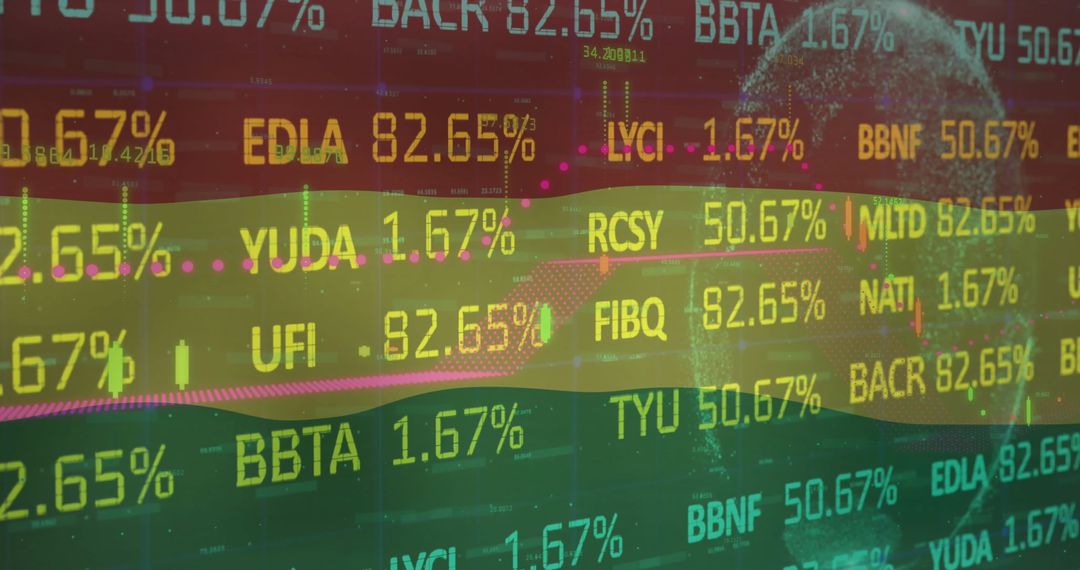
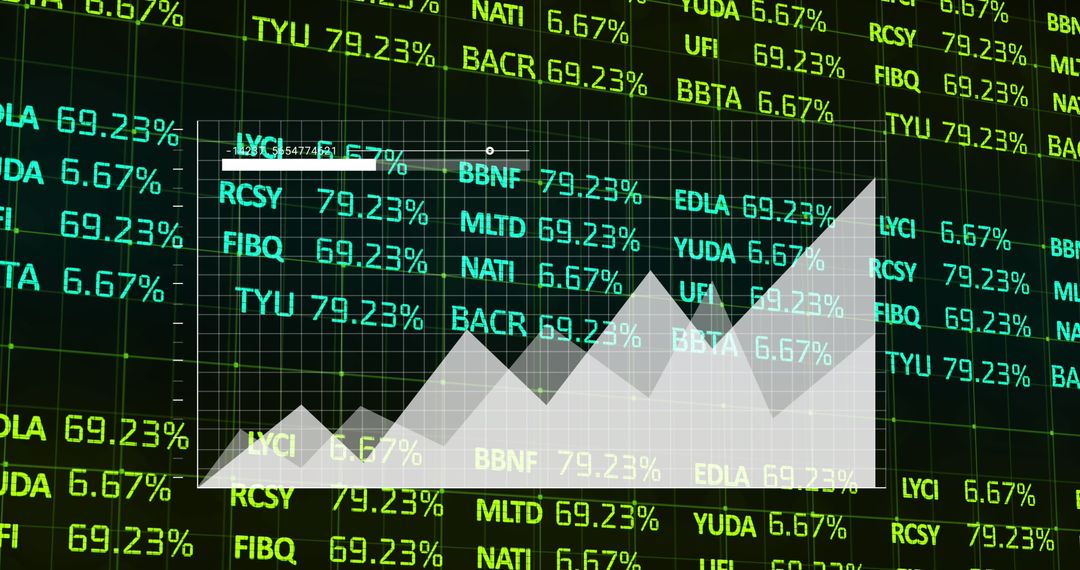
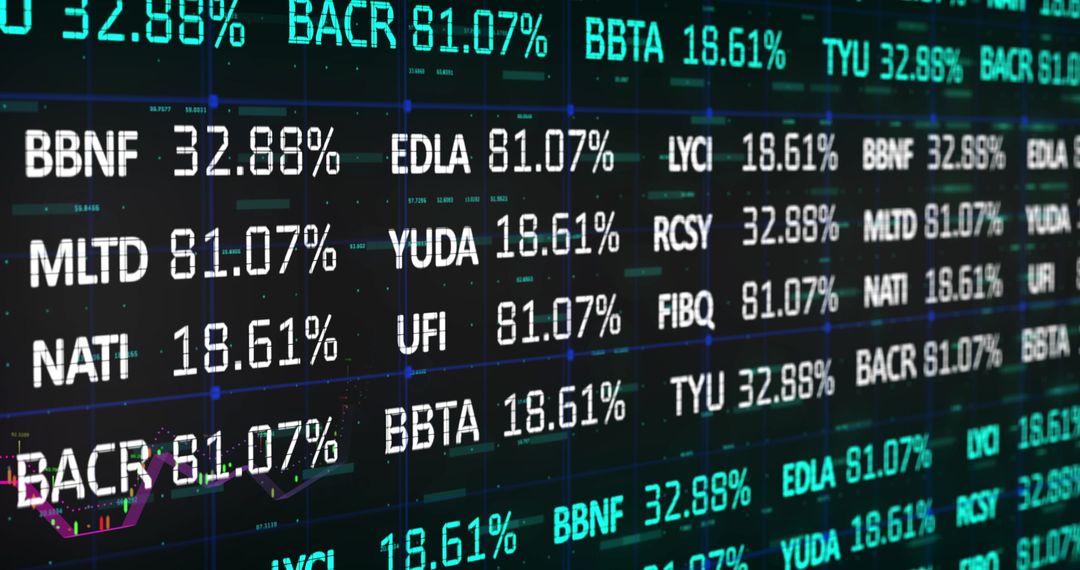
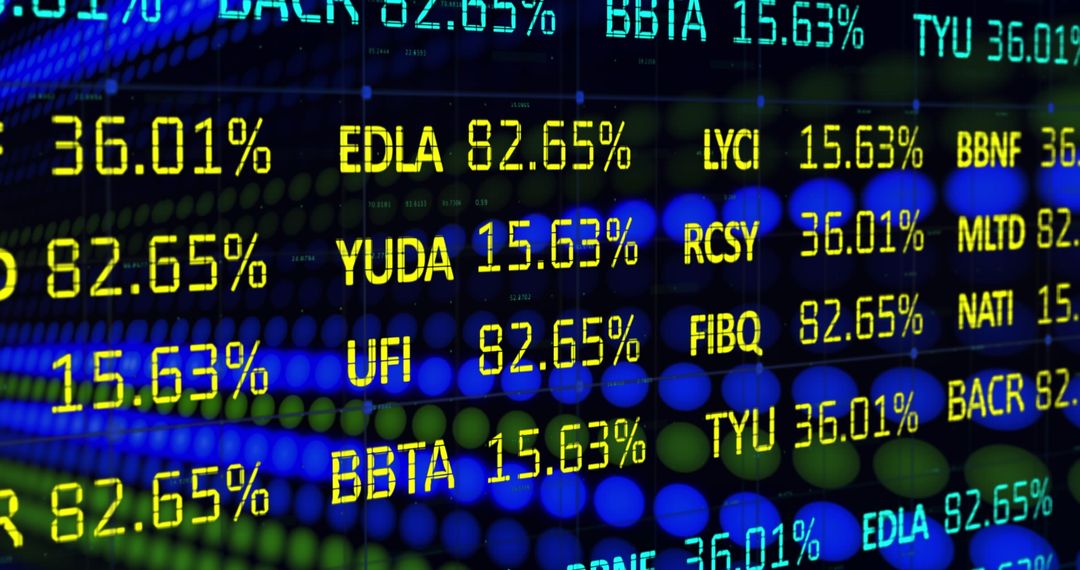
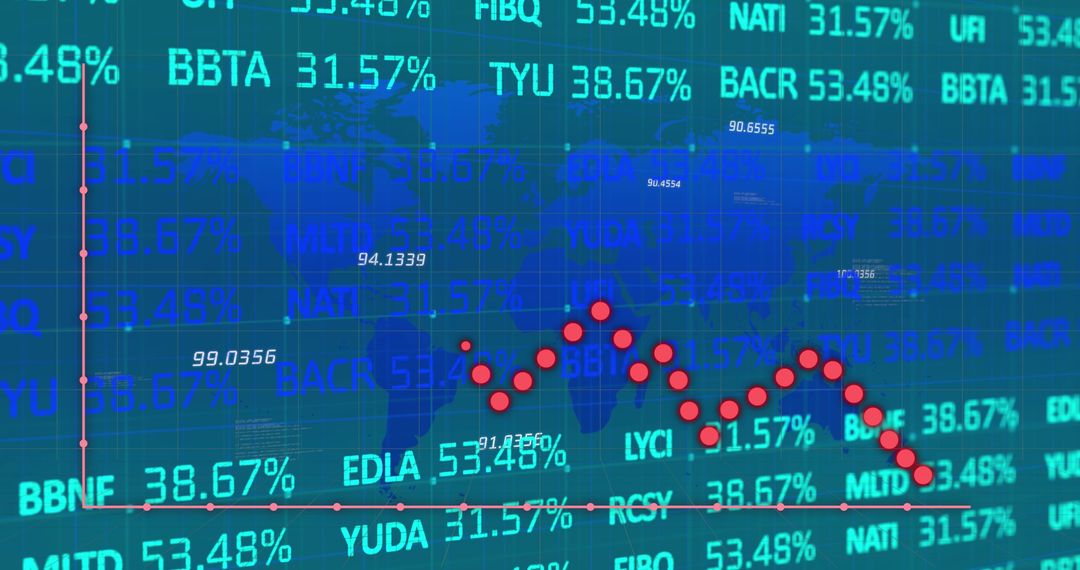
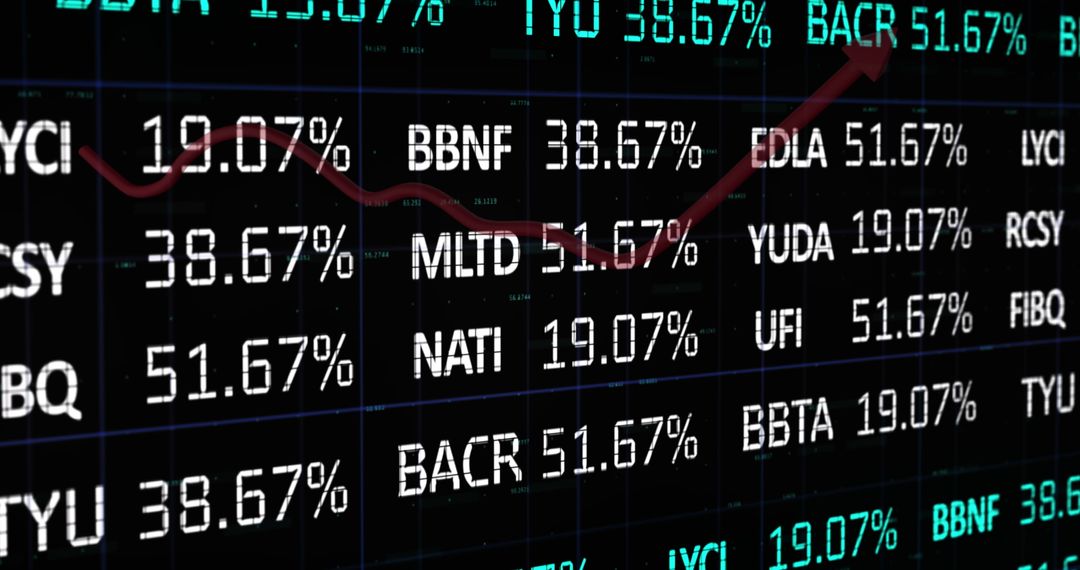
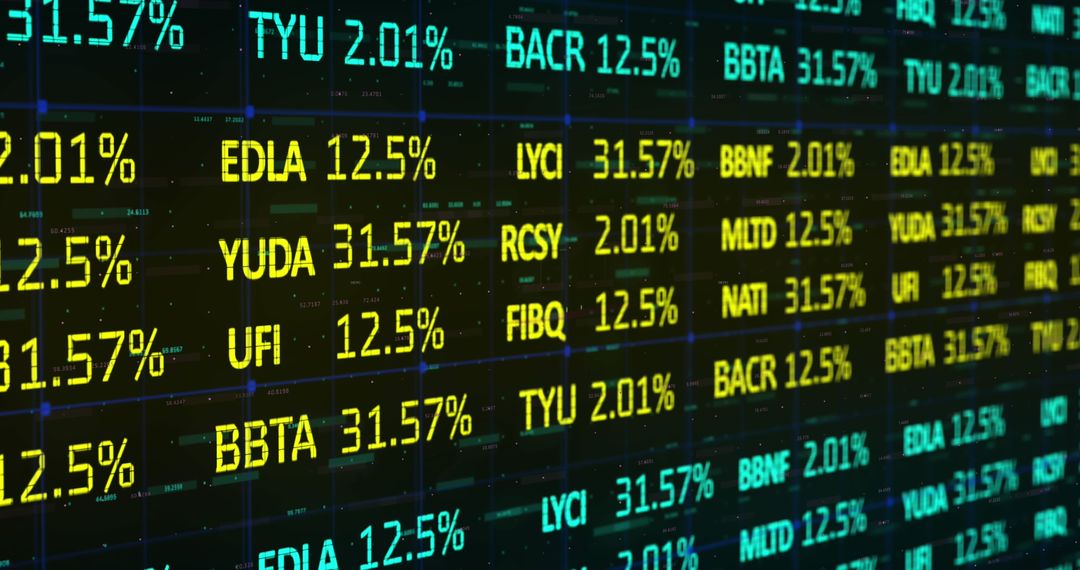
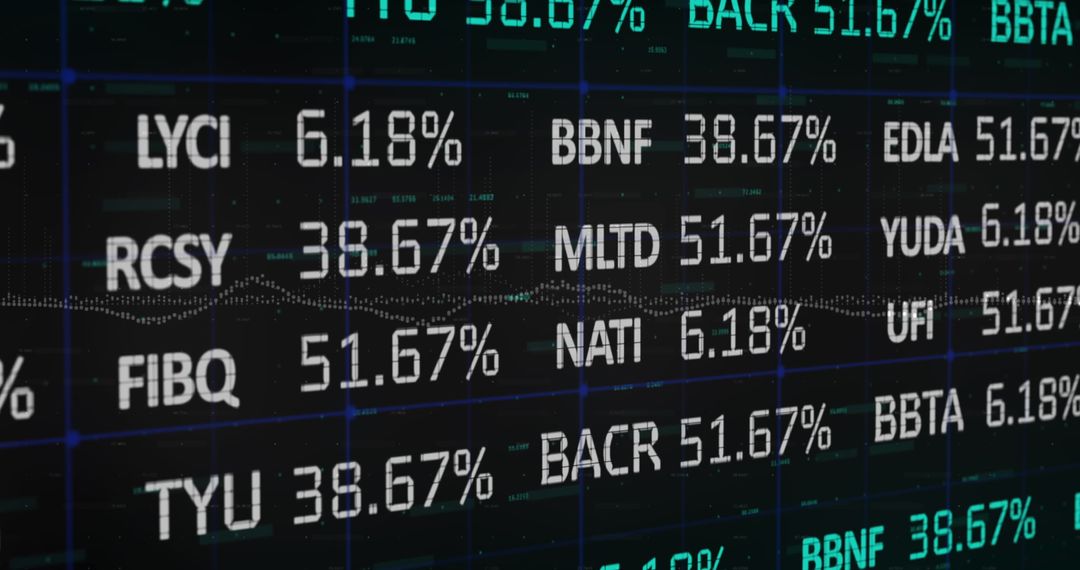
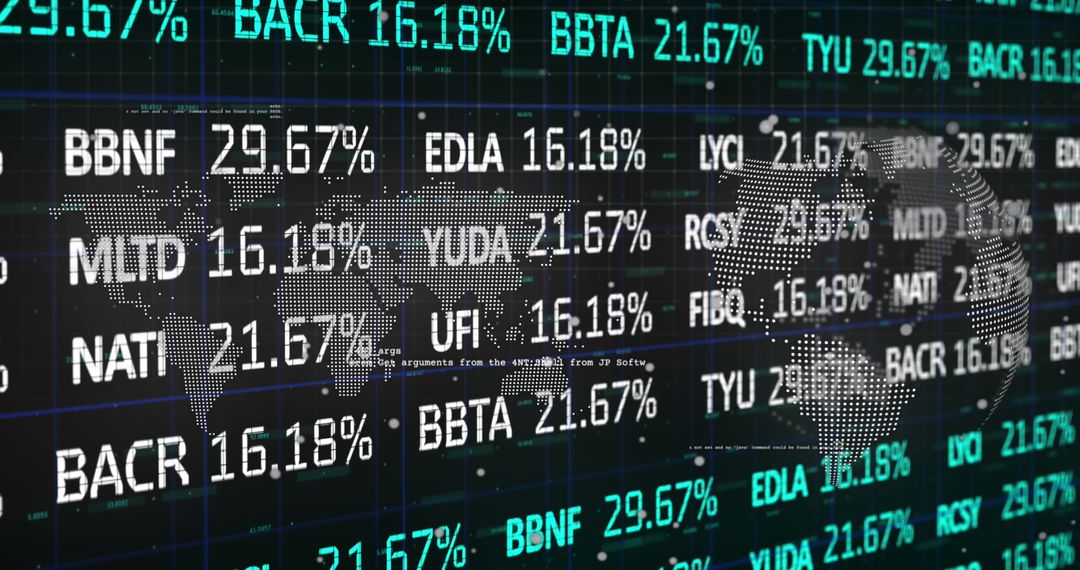
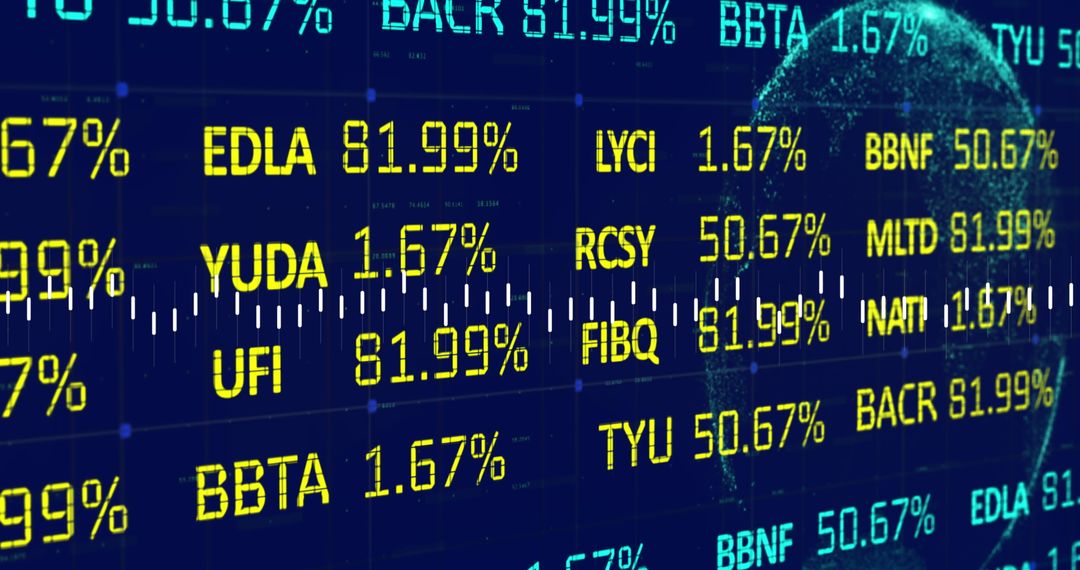
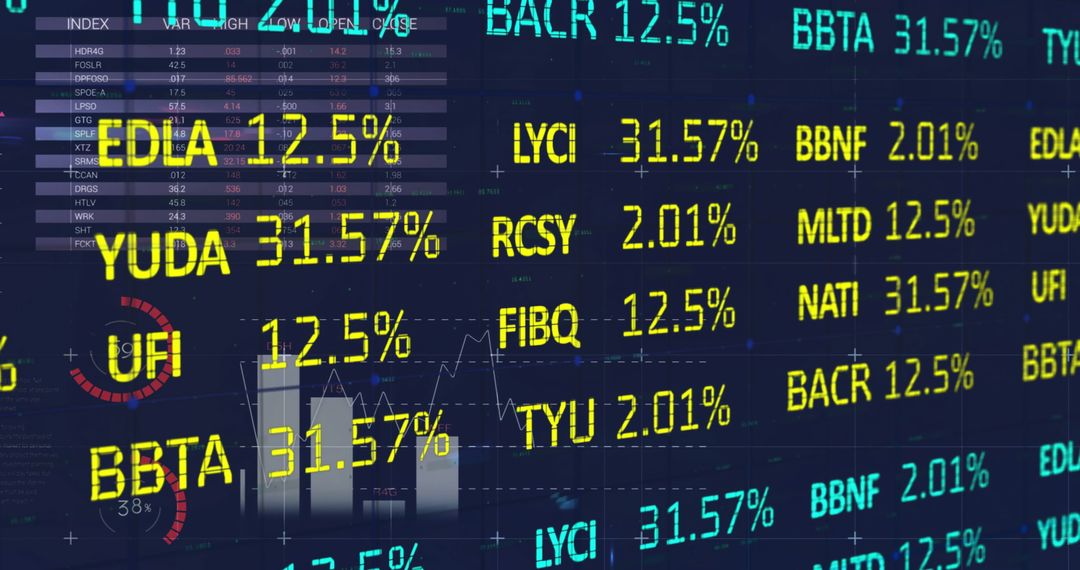
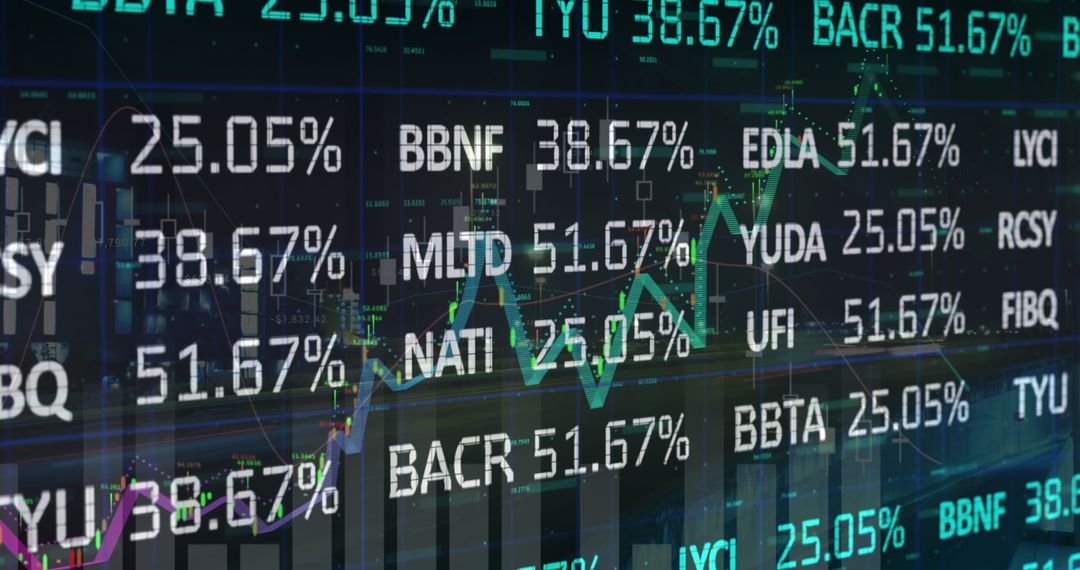
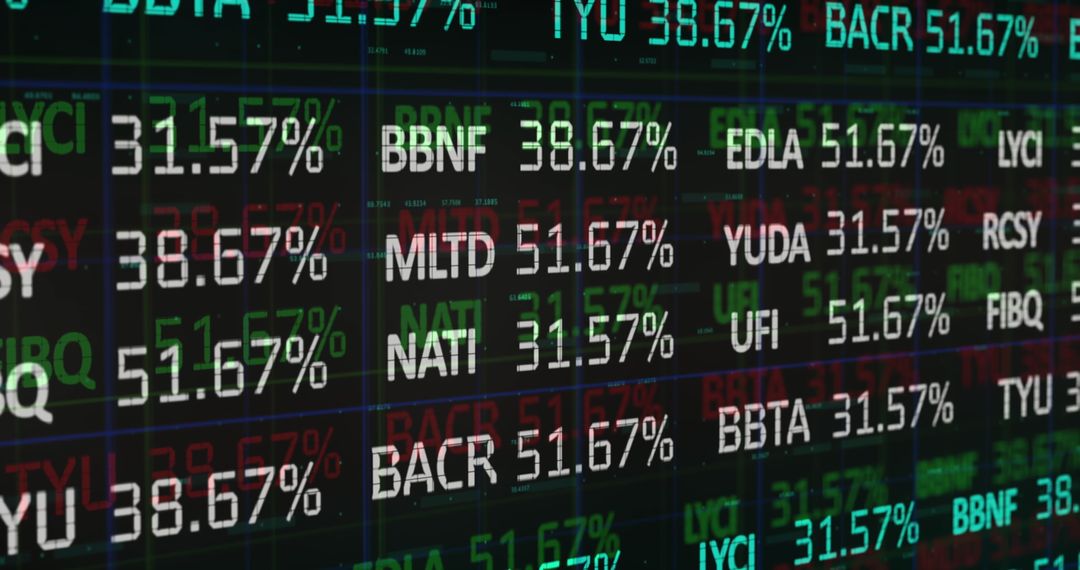
- Dynamic Digital Finance Data Visualization for Stock Market Analysis
Dynamic Digital Finance Data Visualization for Stock Market Analysis Image
Data visualization features dynamically projected on a trading board include various charts, figures, and binary codes associated with the stock market. Perfect for illustrations related to technology-driven financial analysis, stock market reports, economic forecast publications, investment strategy guides, and digital finance advancements.
Powered by 


2
downloads
downloads
Tags:
More
Credit Photo
If you would like to credit the Photo, here are some ways you can do so
Text Link
photo Link
<span class="text-link">
<span>
<a target="_blank" href=https://pikwizard.com/photo/dynamic-digital-finance-data-visualization-for-stock-market-analysis/75cea5f3c53b789ade58433a594f33b0/>PikWizard</a>
</span>
</span>
<span class="image-link">
<span
style="margin: 0 0 20px 0; display: inline-block; vertical-align: middle; width: 100%;"
>
<a
target="_blank"
href="https://pikwizard.com/photo/dynamic-digital-finance-data-visualization-for-stock-market-analysis/75cea5f3c53b789ade58433a594f33b0/"
style="text-decoration: none; font-size: 10px; margin: 0;"
>
<img src="https://pikwizard.com/pw/medium/75cea5f3c53b789ade58433a594f33b0.jpg" style="margin: 0; width: 100%;" alt="" />
<p style="font-size: 12px; margin: 0;">PikWizard</p>
</a>
</span>
</span>
Free (free of charge)
Free for personal and commercial use.
Author: Creative Art
Similar Free Stock Images
Premium

Premium


Premium


Premium


Premium


Premium


Premium


Premium


Premium


Premium


Premium


Premium


Premium


Premium


Premium


Premium


Premium


Premium


Premium


Premium


Premium


Premium


Premium


Premium