
- Home >
- Stock Photos >
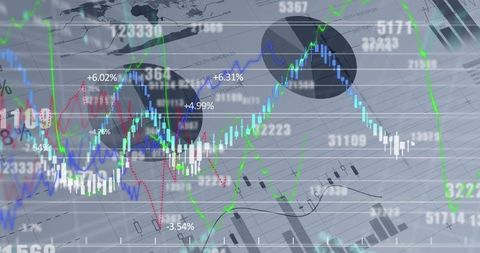
- Dynamic Digital Finance Interface with Statistical Data Displayed
Dynamic Digital Finance Interface with Statistical Data Displayed Image

This visual presents a dynamic digital interface filled with shifting symbols, financial graphs, and statistical data. Suitable for illustrating content in articles about global business finance, data analysis techniques, or digital economy trends, its sophisticated design can appeal to audiences interested in modern technological updates in business sectors.
Powered by 


downloads
Tags:
More
Credit Photo
If you would like to credit the Photo, here are some ways you can do so
Text Link
photo Link
<span class="text-link">
<span>
<a target="_blank" href=https://pikwizard.com/photo/dynamic-digital-finance-interface-with-statistical-data-displayed/eec7c833ddc08a7e5c0441ccc5910b12/>PikWizard</a>
</span>
</span>
<span class="image-link">
<span
style="margin: 0 0 20px 0; display: inline-block; vertical-align: middle; width: 100%;"
>
<a
target="_blank"
href="https://pikwizard.com/photo/dynamic-digital-finance-interface-with-statistical-data-displayed/eec7c833ddc08a7e5c0441ccc5910b12/"
style="text-decoration: none; font-size: 10px; margin: 0;"
>
<img src="https://pikwizard.com/pw/medium/eec7c833ddc08a7e5c0441ccc5910b12.jpg" style="margin: 0; width: 100%;" alt="" />
<p style="font-size: 12px; margin: 0;">PikWizard</p>
</a>
</span>
</span>
Free (free of charge)
Free for personal and commercial use.
Author: Creative Art
Similar Free Stock Images

Premium


Premium


Premium


Premium


Premium


Premium


Premium


Premium


Premium


Premium


Premium

Premium


Premium


Premium

Premium


Premium


Premium


Premium


Premium

Premium


Premium


Premium

Premium


Premium


Premium


Explore More Free Stock Images