- Home >
- Stock Photos >
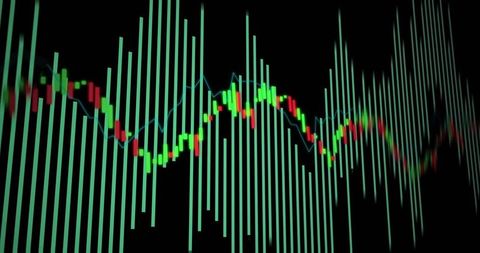
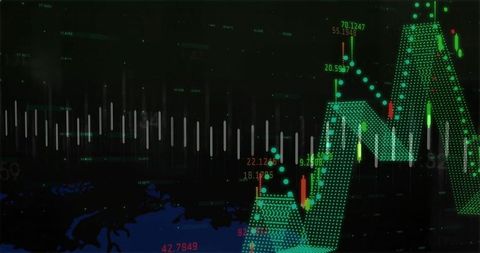
- Dynamic Digital Financial Data Chart Visualization
Dynamic Digital Financial Data Chart Visualization Image

Image shows digital visualization of financial data over black background, with various interactive elements like charts and graphs. Represents concepts related to predicting market trends, business economics, or using data analytics in corporate strategies. Suitable for business presentations, educational materials on economics, or websites dealing with finance technology.

downloads
Tags:
More
Credit Photo
If you would like to credit the Photo, here are some ways you can do so
Text Link
photo Link
<span class="text-link">
<span>
<a target="_blank" href=https://pikwizard.com/photo/dynamic-digital-financial-data-chart-visualization/ec0cbd36d0fc6615ce8ea1e88f2cb93b/>PikWizard</a>
</span>
</span>
<span class="image-link">
<span
style="margin: 0 0 20px 0; display: inline-block; vertical-align: middle; width: 100%;"
>
<a
target="_blank"
href="https://pikwizard.com/photo/dynamic-digital-financial-data-chart-visualization/ec0cbd36d0fc6615ce8ea1e88f2cb93b/"
style="text-decoration: none; font-size: 10px; margin: 0;"
>
<img src="https://pikwizard.com/pw/medium/ec0cbd36d0fc6615ce8ea1e88f2cb93b.jpg" style="margin: 0; width: 100%;" alt="" />
<p style="font-size: 12px; margin: 0;">PikWizard</p>
</a>
</span>
</span>
Free (free of charge)
Free for personal and commercial use.
Author: Creative Art