
- Home >
- Stock Photos >
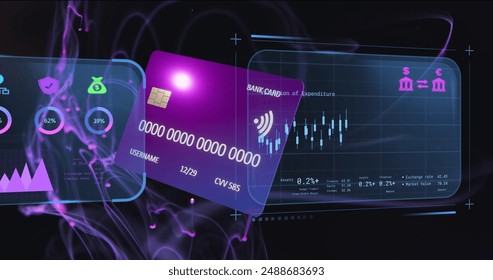
- Dynamic Digital Financial Data Interface Visualization
Dynamic Digital Financial Data Interface Visualization Image

Futuristic visualization of financial data highlights technology integration in global markets. Arrows and graphs indicate trends and movement, offering valuable insight into market analysis and financial technology applications. Ideal for use in topics focused on finance, technology advancements, global computing systems, or data analysis tutorials.
Powered by  - Get 15% off with code: PIKWIZARD15


downloads
Tags:
More
Credit Photo
If you would like to credit the Photo, here are some ways you can do so
Text Link
photo Link
<span class="text-link">
<span>
<a target="_blank" href=https://pikwizard.com/photo/dynamic-digital-financial-data-interface-visualization/7dd36e3e74d3eaa7351bec034cf52e8f/>PikWizard</a>
</span>
</span>
<span class="image-link">
<span
style="margin: 0 0 20px 0; display: inline-block; vertical-align: middle; width: 100%;"
>
<a
target="_blank"
href="https://pikwizard.com/photo/dynamic-digital-financial-data-interface-visualization/7dd36e3e74d3eaa7351bec034cf52e8f/"
style="text-decoration: none; font-size: 10px; margin: 0;"
>
<img src="https://pikwizard.com/pw/medium/7dd36e3e74d3eaa7351bec034cf52e8f.jpg" style="margin: 0; width: 100%;" alt="" />
<p style="font-size: 12px; margin: 0;">PikWizard</p>
</a>
</span>
</span>
Free (free of charge)
Free for personal and commercial use.
Author: Creative Art
Similar Free Stock Images

Premium

Premium

Premium


Premium


Premium


Premium


Premium


Premium


Premium

Premium


Premium

Premium


Premium


Premium


Premium


Premium


Premium


Premium


Premium


Premium


Premium


Premium


Premium


Premium


Premium


Explore More Free Stock Images