
- Home >
- Stock Photos >
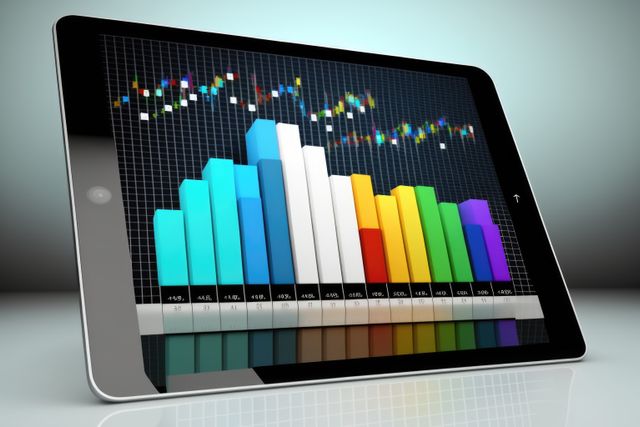
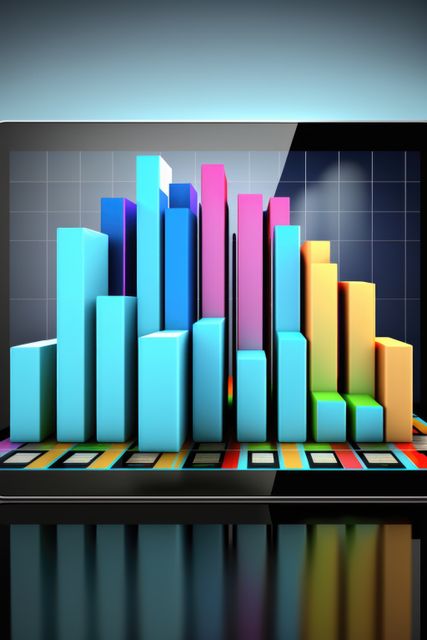
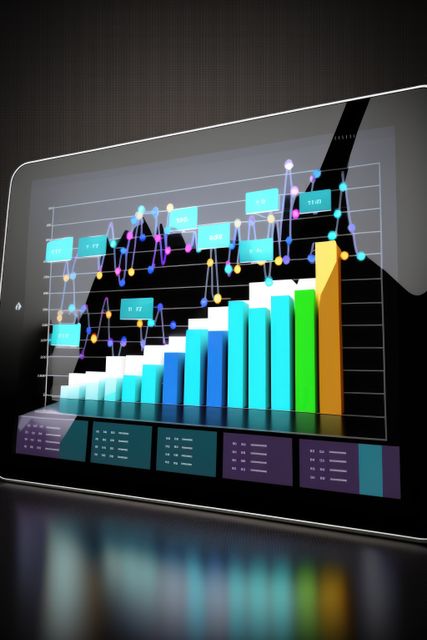
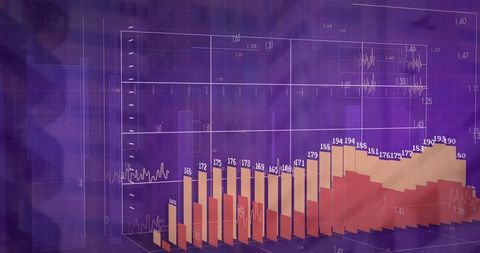
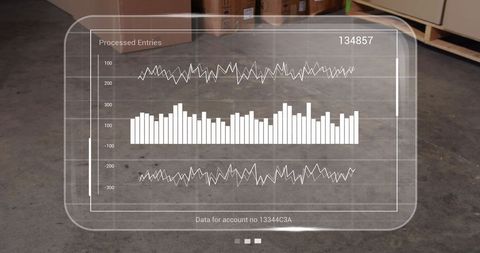
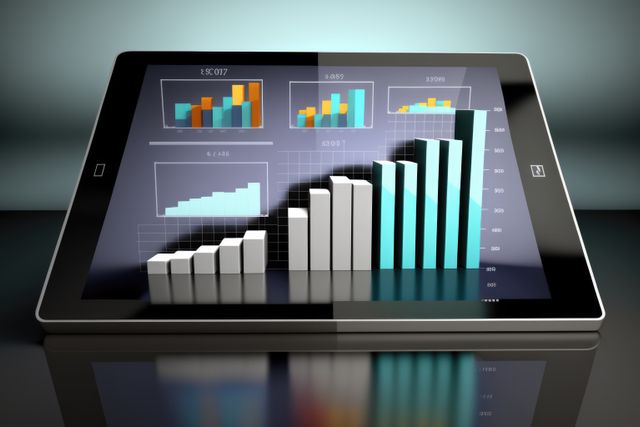
- Dynamic Digital Graph Presentation on Tablet Screen
Dynamic Digital Graph Presentation on Tablet Screen Image

AI
AI Generated Image. Vibrantly colored bar chart projected on a tablet screen, symbolizing high-tech data analysis. Suitable for illustrating modern business strategies, technology in finance, and digital statistics presentations. Useful for blogs, financial reports, and tech-driven educational content.

downloads
Tags:
More
Credit Photo
If you would like to credit the Photo, here are some ways you can do so
Text Link
photo Link
<span class="text-link">
<span>
<a target="_blank" href=https://pikwizard.com/photo/dynamic-digital-graph-presentation-on-tablet-screen/2acf7d4aed32bb3e0d73e5255c102b2c/>PikWizard</a>
</span>
</span>
<span class="image-link">
<span
style="margin: 0 0 20px 0; display: inline-block; vertical-align: middle; width: 100%;"
>
<a
target="_blank"
href="https://pikwizard.com/photo/dynamic-digital-graph-presentation-on-tablet-screen/2acf7d4aed32bb3e0d73e5255c102b2c/"
style="text-decoration: none; font-size: 10px; margin: 0;"
>
<img src="https://pikwizard.com/pw/medium/2acf7d4aed32bb3e0d73e5255c102b2c.jpg" style="margin: 0; width: 100%;" alt="" />
<p style="font-size: 12px; margin: 0;">PikWizard</p>
</a>
</span>
</span>
Free (free of charge)
Free for personal and commercial use.
Author: AI Creator
Similar Free Stock Images
AI


AI


AI

AI


AI


AI

AI


AI


AI


AI


AI
AI


AI


AI


AI


AI


AI


AI


AI


Explore More Free Stock Images