1. Home > 
  2. Stock Photos > 
  3. Dynamic Digital Interface for Data Analysis and Statistics

Dynamic Digital Interface for Data Analysis and Statistics Image

Dynamic Digital Interface for Data Analysis and Statistics

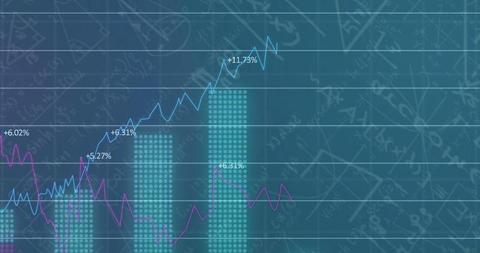
This image features a digital interface with data lines and statistics overlaid on mathematical equations, symbolizing advancements in data analysis and technology integration in finance. Effective for illustrating financial reports, technology newsletters, or backgrounds in presentations related to statistics or data-driven strategies.

Powered by Shutterstock logo - Get 15% off with code: PIKWIZARD15
Big data technology and data science with person touching data flowing on virtual screen. Business analytics, artificial intelligence, machine learning. Engineer or scientist analyzing stream of data. - Powered by Shutterstock - Get 15% off with code: PIKWIZARD15AI, Big Data, and business analytics icons represent the integration of advanced technology in analyzing graphs, business data, and market trends, driving strategic decisions and innovative solutions. - Powered by Shutterstock - Get 15% off with code: PIKWIZARD15Big data technology and data science. Data scientist querying, analysing and visualizing complex set on virtual screen. Data flow concept. Neural network, artificial intelligence, ML, analytics. - Powered by Shutterstock - Get 15% off with code: PIKWIZARD15Desktop Computer Monitor with Finance Statistical Data Software and Progressive User Interface Standing on the Desk in the Modern Business Office. In the Background Glass Wall with Big City Office. - Powered by Shutterstock - Get 15% off with code: PIKWIZARD15Business finance data analytics graph.Financial management technology.Advisor using KPI Dashboard on virtual screen. - Powered by Shutterstock - Get 15% off with code: PIKWIZARD15

Credit Photo

If you would like to credit the Photo, here are some ways you can do so

Free (free of charge)

Free for personal and commercial use.

Author: People Creations

Similar Free Stock Images

Digital Graphs Displaying Financial Data Analysis in Blue
Premium
Woman hold smartphone use pc at workplace. Project stats financial data sales charts on laptop and cellphone screen, close up view over shoulder. Report preparation, synchronization for safety concept
Global Finance and Economy Interface with Digital Graphs
Futuristic Financial Data Analytics with Digital Interface Concept
Digital Data Footprint with 6G Network Technology Concept
Financial Chart Analysis and Data Visualization Concept
Premium
Businessman showing result of growth company profit planning, opportunity, challenge and business strategy graphs and target of business. Banner of plan and visions for financial and economy analysis.
Digital Financial Interface with Dynamic Graphs and Data Analysis
Financial Data Over Electric Sky Concept for Energy Sector
Digital Interface Overlay with Global Financial Data Display
Rising Graphs and Interactive Financial Data Analytics Background
Premium
Businessman analysis enterprise data management by AI artificial intelligence technology. Business analytics dashboard charts, metrics, KPI to improve, insight report for operation. Analyst marketing,
Dynamic Stock Market Analysis with Blue Graphs and Percentages
Rising Data Trends on Gradient Graph with Business Insights
Innovative 5G Network Technology with Digital Interface
Statistical Financial Data Analysis on Digital Grid
Premium
young entrepreneur using big data analysis and cloud technology to collect customer data and display on application dashboard from digital tablet to understand sale forecast and marketing plan.
Global Data Analytics and Network Visualization on Digital Grid
Cybersecurity Locks - Digital Security and Data Protection Concept
Digital Fingerprint with Data Overlay on Futuristic Interface
Financial Growth Chart Over Urban Cityscape, Business Data Concept
Premium
Businessman using futuristic user interface with virtual data analytics. Innovative dashboard with financial charts, graphs, and global network information for business intelligence.
Digital Data Processing with Animated Bar Graphs on Global Scale
Global Financial Data Analysis and Technology Trends
Digital Data Display with Circuit Elements and Abstract Timing
Digital Financial Data with Graphs and Charts on Blue Background
Premium
Businessman points a graph depicting the growth of business, data analysis in shaping a thriving global enterprise of blockchain technology and strategic planning in the modern business
Digital Decline Graphic with QR Code Elements and Red Line
Abstract Digital Data Charts Illustrating Market Trends
Futuristic Bar Chart with Trend Lines on Digital Interface
Futuristic Financial Chart on Glass Display Showing Growth Trends
Dynamic Stock Market Ticker and Graph Analysis
Dynamic Financial Data Analysis Illustration
Premium
Analyzing Key Performance Indicators. Businessman using digital screen to analyze key performance indicators (KPI) with various graphs and charts, showcasing data analysis and performance tracking.
Monochromatic Financial Data and Chart Analysis
Digital Data Analysis with Futuristic Charts
Financial Growth Chart Displaying Performance Trends
Dynamic Financial Data on Digital Display Canvas
Premium
Futuristic Digital Growth Chart – 3D Bar Graph with Glowing Blue Data Visualization
Digital Data with Financial Graphs on Global Grid
Diverse Graphs and Data Over Urban Landscape
Futuristic Financial and Technological Data Visualization Concept
Digital Data Processing with Neon Frame Highlighting Trends
Premium
Business finance data analytics graph.Financial management technology.Advisor using KPI Dashboard on virtual screen.
Dynamic Statistical Data Analysis with Gradient Colors
Digital Data Analytics Showing Bar Graph and Curves on Black Background
Stock Market Data Visuals Analyze Global Economic Trends
Financial Data Visualization with Growing Business Charts
Premium
AI, Big Data, and business analytics icons represent the integration of advanced technology in analyzing graphs, business data, and market trends, driving strategic decisions and innovative solutions.
Financial Graph Analyzing Stock Market Trends
Digital Fingerprint Overlayed on Financial Data Illustrating Cybersecurity
Digital Interface with Data Analysis Graphics on Blue Background
Dynamic Financial Data Charts and Graphs Background
Premium
Businessman pointing chart financial goals and economic business planning global.
Innovative Digital Finance Data Display on Dark Interface
Global Financial Analytics on Digital World Map
Digital Display of Financial Data and Statistics
Analyzing Financial Data with Global Trends and Charts
Premium
Financial technology concept. Stock chart. Investment. Fintech.
Neon Circle Highlights Bullish Trend on Digital Dashboard
Digital Healthcare Analytics Interface with Graphs and Networks
Cyan and Magenta Analytics Dashboard Showing Bar Charts, Trend Lines and Circular Icons
Global Data Analytics with World Map and Bar Graph
Mathematical Formulas and Red Line Graph in Foggy Background
Digital Security Illustration with Graph and Binary Codes
Premium
Hand holding smartphone displays data visualizations, including histogram and pie chart. Analytics, digital transformation and increasing use of mobile technology in business. Minimalist art collage.
Digital Financial Data Display with Graphs and Analytics
Abstract Financial Data Display with Analytical Graphs
Rising Financial Graphs with Digital Data Interface
Digital Financial Data Analytics with Graphs and Codes
Premium
Man look at the dashboard with graphs and charts. Concept of data management system, business intelligence, data statistics, marketing analysis, key performance indicators (KPI) and analytics.
Dynamic Stock Market Graphics on Modern Digital Interface
Rising Financial Graph on Purple Background
Digital Interface with Sale Graphics and Data Patterns
Financial Data Visualization with Urban Nightscape
Premium
young entrepreneur using big data analysis and cloud technology to collect customer data and display on application dashboard from digital tablet to understand sale forecast and marketing plan.
Financial Data Analysis with Graph and Connectivity
Floating Numbers Over Cityscape Representing Statistical Analysis
Financial Data Processing with Digital Graph Overlay
Dynamic Financial Graphs Illustrating Business Growth
Premium
Scientist working with business data, finance, marketing report, Big Data Analytics technology, Processing Complexity information flow on virtual screen, machine learning, artificial intelligence, ML
Futuristic Digital Globe with Codes and Get Details Text Overlay
Global Financial Data Processing with Digital Interface Elements
Financial Data Visualization with Dynamic Graphs and Charts
Financial Data Overlay with Finnish Flag and Currency Symbols
Premium
Man look at the dashboard with graphs and charts. Concept of data management system, business intelligence, data statistics, marketing analysis, key performance indicators (KPI) and analytics.
Financial Data Analytics with Interactive Graphs and Charts
Futuristic Financial Data Analysis with Graphs and Charts
Digital Financial Analysis Interface Over Data Grid
Dynamic Financial Data Charts and Digital Interface Concepts
Premium
Business analysis big data screen and economic growth with financial graph. Concept of virtual dashboard technology digital marketing and global economy network connection. 3D illustration.
Financial Growth Represented by Upward Trending Digital Chart
Financial data dashboard showing rising bar charts and trend lines over city glass facade
Interactive Data Analytics and DNA Digital Interface
Global Financial Data Analysis with Graphs on Digital Interface
Financial Graphics Overlap with Electrical Power Lines
Digital Graphs and Charts on Tech Background Illustrating Data Analysis
Premium
Professional woman interacting with digital sales dashboard displaying various charts and graphs in modern office
Abstract Graph Display with Dynamic Business Growth Indicators
Digital Data Visualization with Dynamic Graph and Global Interface
Abstract Financial Data Visualization with Global Connections
Financial Data Processing Overlaying Urban Streetscape
Premium
Businessman using tablet Analytics Data KPI Dashboard Tech with charts, metrics, and KPI to analyze performance and create insight reports for operations management.Data mining.Data analysis.Ai
Global Data Exchange Network
Dynamic Statistical Data Over Grid Network Isolated on White
Stock Market Trends and Data Analysis over Digital Grid
Digital Visualization Financial Data Growth Progressive Graph
Premium
Online trading, Investment, Strategy market plan, and Stock mark
Financial Data and Graphs with Futuristic Interface
Statistical Graphs Over Cityscape Highlighting Business Growth
Financial Data Analysis on World Map Background
Abstract Global Network with Dynamic Graphs
Premium
Advisor using KPI Dashboard on virtual screen.Business finance data analytics graph.Financial management technology.
Digital Financial Data with Graphs and Numbers Illustrations
Dynamic Financial Graphs and Data Fluctuations
Digital Finance Graphs Showing Market Trends
Digital Interface with Overlapping Code and Graph
Premium
Indian Male Logistics Expert Holding Laptop Computer And Analyzing World Map On Big Digital Screen In Monitoring Office. Successful Man Developing New Efficient Routs For Global Product Distribution.
Digital Financial Data Analysis on Futuristic Blue Interface
Stock Market Decline Data Analysis on Dark Grid Background
Digital Stock Market Data Interface with Charts and Graphs
Dynamic Data Trends with Line and Bar Graphs
Premium
Businessman analyze and visualize complex information on a virtual screen using AI to process data. Big data technology and data science.Data flow.Digital neural network.artificial intelligence
Dark Financial Dashboard Displaying Real-Time Analytics, Index Table, Americas Map, Gauges