
- Home >
- Stock Photos >
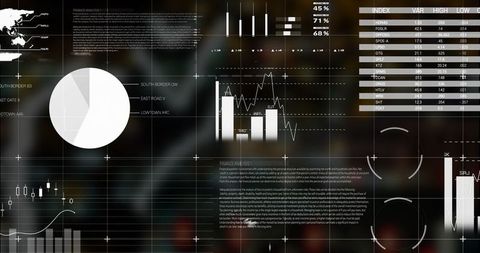
- Dynamic Digital Interface with Changing Financial Statistics
Dynamic Digital Interface with Changing Financial Statistics Image
This abstract representation of changing financial data on a digital interface highlights finance, business opportunities, data analytics, and global economic trends. Use in articles or presentations relating to economic forecasts, financial technologies, data analysis, business strategies, and investment insights. The vivid visualization aids in emphasizing concepts related to economic metrics and dynamic markets.
Powered by 


downloads
Tags:
More
Credit Photo
If you would like to credit the Photo, here are some ways you can do so
Text Link
photo Link
<span class="text-link">
<span>
<a target="_blank" href=https://pikwizard.com/photo/dynamic-digital-interface-with-changing-financial-statistics/b8b0cfaf695d68778b3d480ac755f844/>PikWizard</a>
</span>
</span>
<span class="image-link">
<span
style="margin: 0 0 20px 0; display: inline-block; vertical-align: middle; width: 100%;"
>
<a
target="_blank"
href="https://pikwizard.com/photo/dynamic-digital-interface-with-changing-financial-statistics/b8b0cfaf695d68778b3d480ac755f844/"
style="text-decoration: none; font-size: 10px; margin: 0;"
>
<img src="https://pikwizard.com/pw/medium/b8b0cfaf695d68778b3d480ac755f844.jpg" style="margin: 0; width: 100%;" alt="" />
<p style="font-size: 12px; margin: 0;">PikWizard</p>
</a>
</span>
</span>
Free (free of charge)
Free for personal and commercial use.
Author: People Creations
Similar Free Stock Images

Premium


Premium

Premium


Premium


Premium

Premium


Premium


Premium


Premium

Premium

Premium


Premium

Premium


Premium


Premium


Premium


Premium


Premium


Premium


Premium


Premium


Premium


Premium


Premium


Premium


Explore More Free Stock Images