- Home >
- Stock Photos >
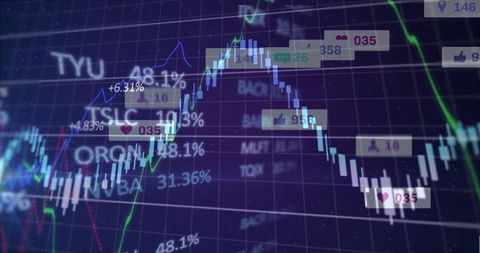
- Dynamic Digital Interface with Stock Market Tickers
Dynamic Digital Interface with Stock Market Tickers Image

This vibrant visual graph showcases a candlestick chart with a green trend line paired with live ticker symbols, representing economic trends and financial data analysis on a digital interface. Ideal for illustrating themes of market dynamics, technical analysis, and investment opportunities. Suitable for use in finance-related presentations, investment blogs, and educational content discussing market trends and trading strategy.

downloads
Tags:
More
Credit Photo
If you would like to credit the Photo, here are some ways you can do so
Text Link
photo Link
<span class="text-link">
<span>
<a target="_blank" href=https://pikwizard.com/photo/dynamic-digital-interface-with-stock-market-tickers/8a364810ecec7e040493169b71ccada5/>PikWizard</a>
</span>
</span>
<span class="image-link">
<span
style="margin: 0 0 20px 0; display: inline-block; vertical-align: middle; width: 100%;"
>
<a
target="_blank"
href="https://pikwizard.com/photo/dynamic-digital-interface-with-stock-market-tickers/8a364810ecec7e040493169b71ccada5/"
style="text-decoration: none; font-size: 10px; margin: 0;"
>
<img src="https://pikwizard.com/pw/medium/8a364810ecec7e040493169b71ccada5.jpg" style="margin: 0; width: 100%;" alt="" />
<p style="font-size: 12px; margin: 0;">PikWizard</p>
</a>
</span>
</span>
Free (free of charge)
Free for personal and commercial use.
Author: People Creations