
- Home >
- Stock Photos >
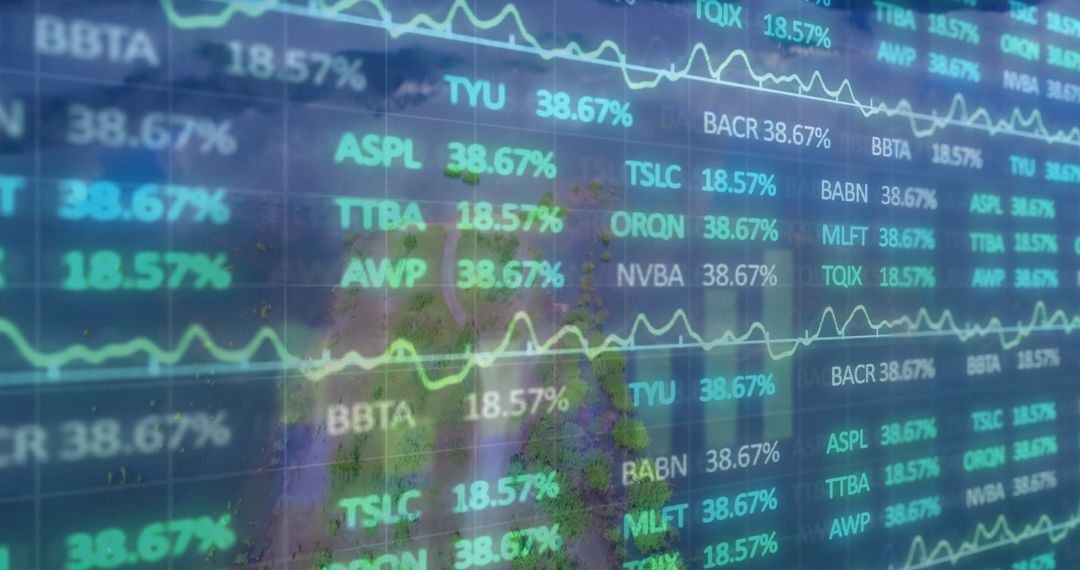
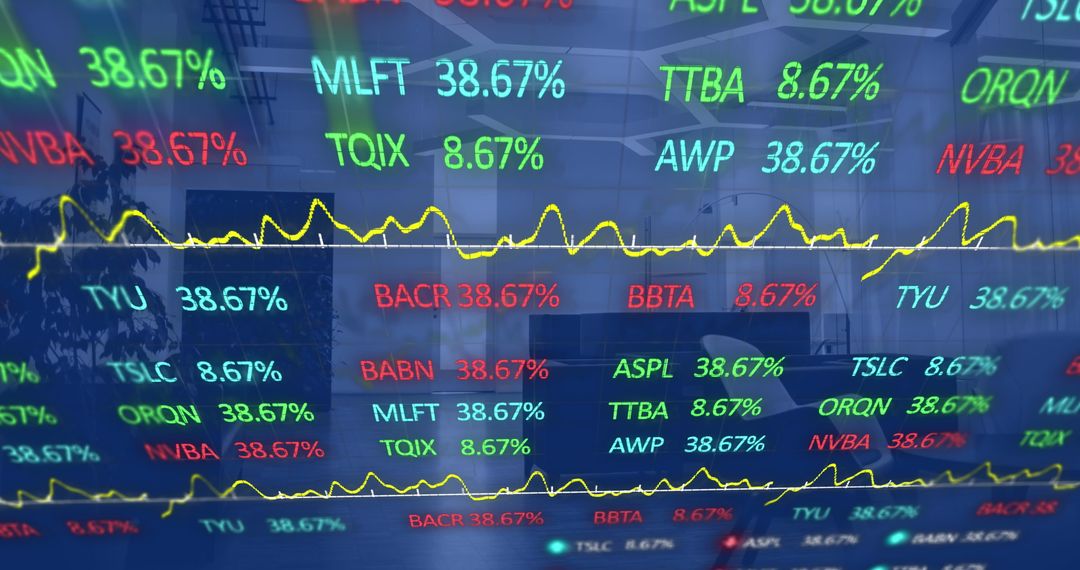
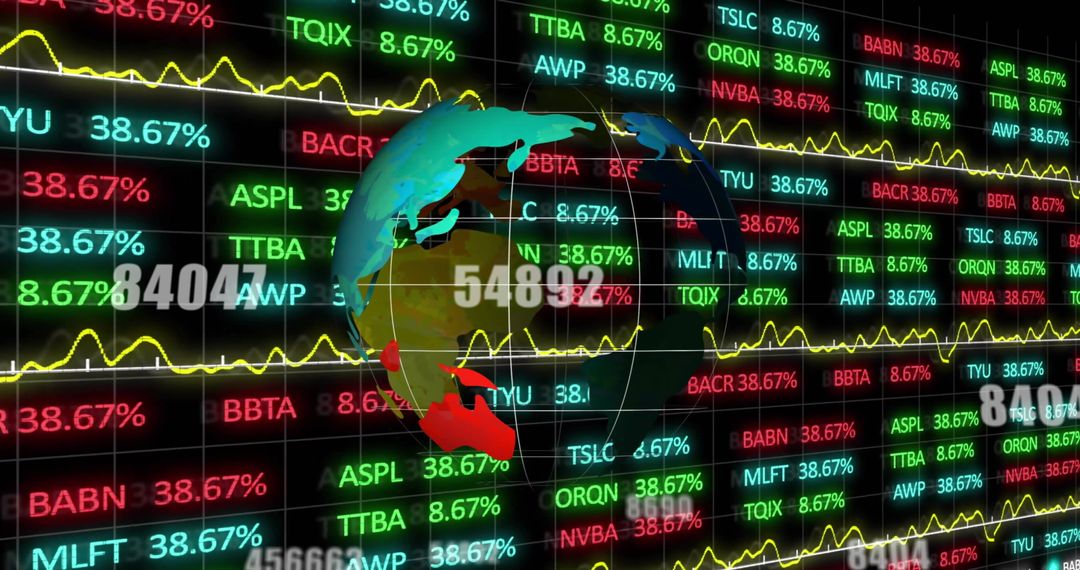
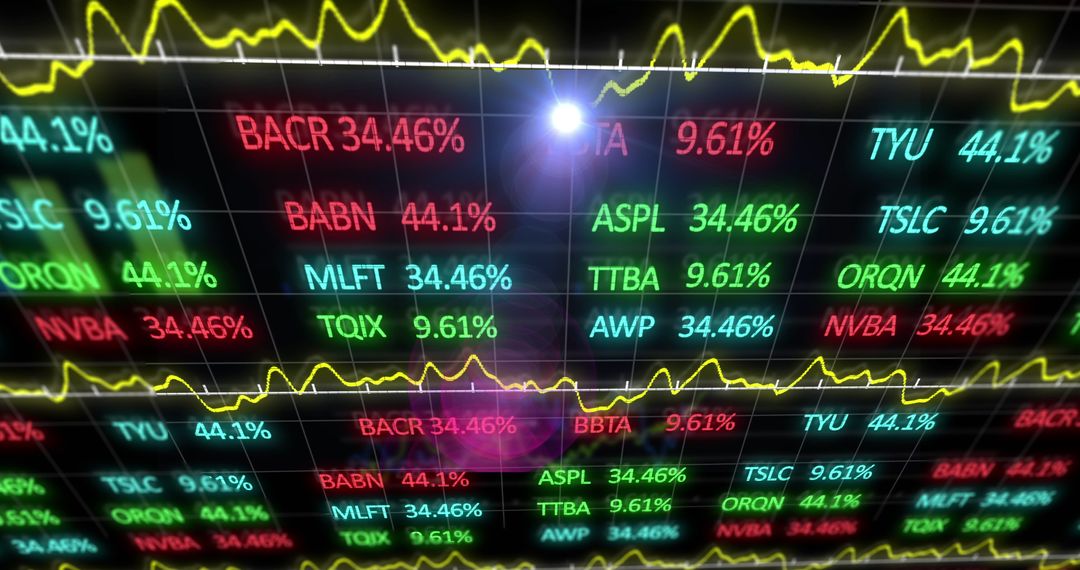
- Dynamic Digital Stock Market Dashboard with Financial Data Graphs
Dynamic Digital Stock Market Dashboard with Financial Data Graphs Image

Colorful digital display showcasing fluctuating financial data and stock market graphs reflects dynamic global financial activity. Useful for illustrating concepts in global finance, economic trends analysis, investment opportunities, trading, economic reports, and digital technology interfaces, making perfect visual for educational and financial platforms.
Powered by 


2
downloads
downloads
Tags:
More
Credit Photo
If you would like to credit the Photo, here are some ways you can do so
Text Link
photo Link
<span class="text-link">
<span>
<a target="_blank" href=https://pikwizard.com/photo/dynamic-digital-stock-market-dashboard-with-financial-data-graphs/b40218accc66ebc39492e728e750d6ef/>PikWizard</a>
</span>
</span>
<span class="image-link">
<span
style="margin: 0 0 20px 0; display: inline-block; vertical-align: middle; width: 100%;"
>
<a
target="_blank"
href="https://pikwizard.com/photo/dynamic-digital-stock-market-dashboard-with-financial-data-graphs/b40218accc66ebc39492e728e750d6ef/"
style="text-decoration: none; font-size: 10px; margin: 0;"
>
<img src="https://pikwizard.com/pw/medium/b40218accc66ebc39492e728e750d6ef.jpg" style="margin: 0; width: 100%;" alt="" />
<p style="font-size: 12px; margin: 0;">PikWizard</p>
</a>
</span>
</span>
Free (free of charge)
Free for personal and commercial use.
Author: Creative Art
Similar Free Stock Images

Premium


Premium


Premium


Premium


Premium


Premium


Premium


Premium


Premium


Premium


Premium


Premium


Premium


Premium


Premium


Premium


Premium


Premium


Premium


Premium


Premium


Premium


Premium


Premium

