- Home >
- Stock Photos >
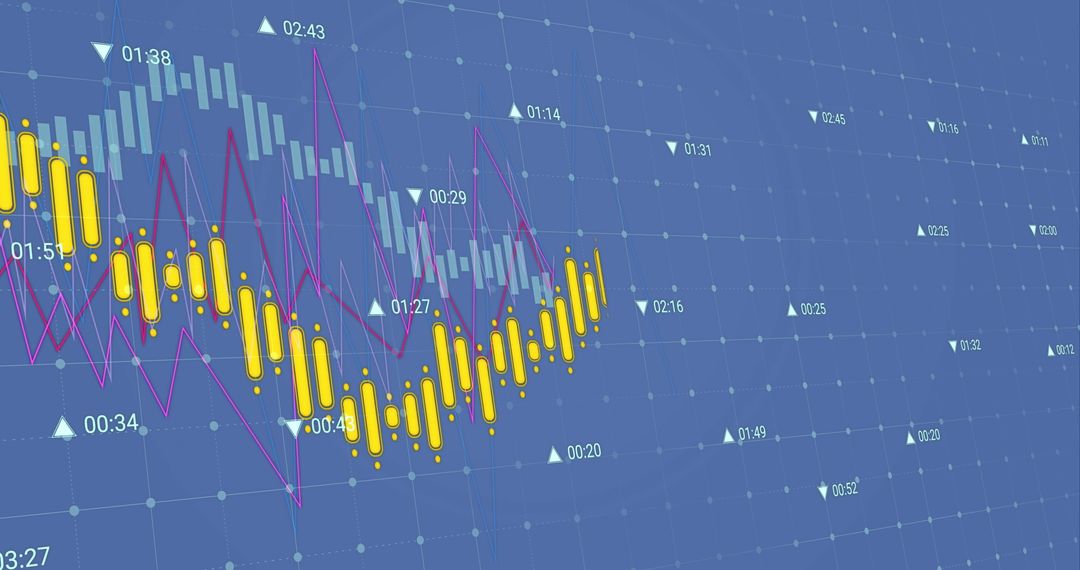
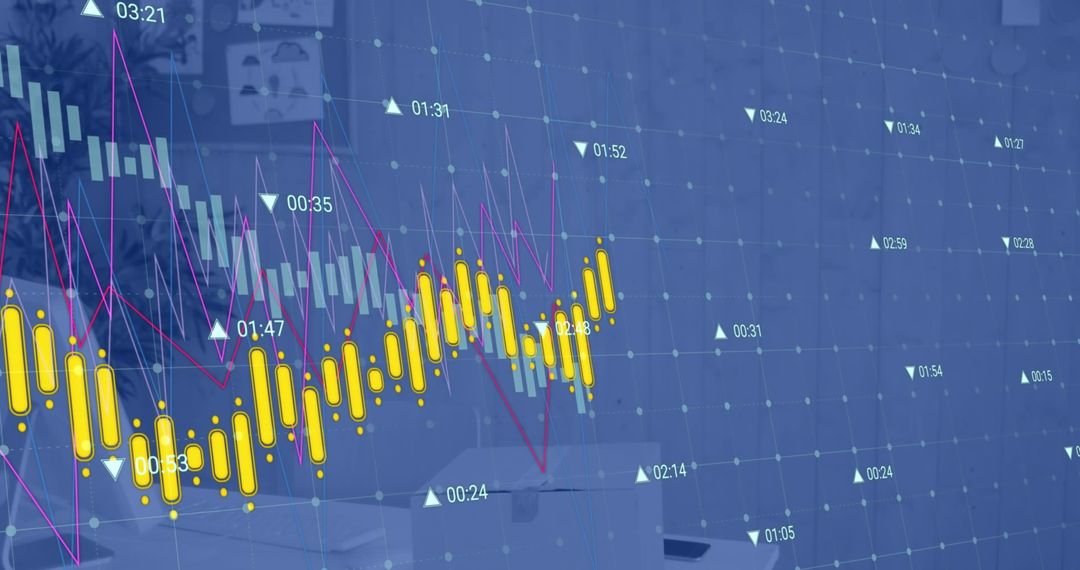
- Dynamic Digital Stock Market Data on Grid Background
Dynamic Digital Stock Market Data on Grid Background Image

The image focuses on a dynamic visual representation of stock market data over a digital grid background. It portrays global financial connections and trends through engaging colorful graphs and charts. Effective for use in presentations, articles, or website backgrounds related to finance, data analysis, investment strategies, or technological advances in stock trading.
Powered by  - Get 15% off with code: PIKWIZARD15


2
downloads
downloads
Tags:
More
Credit Photo
If you would like to credit the Photo, here are some ways you can do so
Text Link
photo Link
<span class="text-link">
<span>
<a target="_blank" href=https://pikwizard.com/photo/dynamic-digital-stock-market-data-on-grid-background/1b5224a03293f4e56c74b5cdd49c87dd/>PikWizard</a>
</span>
</span>
<span class="image-link">
<span
style="margin: 0 0 20px 0; display: inline-block; vertical-align: middle; width: 100%;"
>
<a
target="_blank"
href="https://pikwizard.com/photo/dynamic-digital-stock-market-data-on-grid-background/1b5224a03293f4e56c74b5cdd49c87dd/"
style="text-decoration: none; font-size: 10px; margin: 0;"
>
<img src="https://pikwizard.com/pw/medium/1b5224a03293f4e56c74b5cdd49c87dd.jpg" style="margin: 0; width: 100%;" alt="" />
<p style="font-size: 12px; margin: 0;">PikWizard</p>
</a>
</span>
</span>
Free (free of charge)
Free for personal and commercial use.
Author: Creative Art
Similar Free Stock Images

Premium


Premium


Premium


Premium


Premium


Premium


Premium


Premium


Premium


Premium


Premium


Premium


Premium


Premium


Premium


Premium


Premium


Premium


Premium


Premium


Premium


Premium


Premium


Premium