
- Home >
- Stock Photos >
- Dynamic Digital Stock Market Data Visualization
Dynamic Digital Stock Market Data Visualization Image

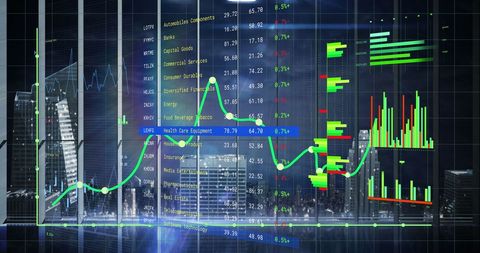
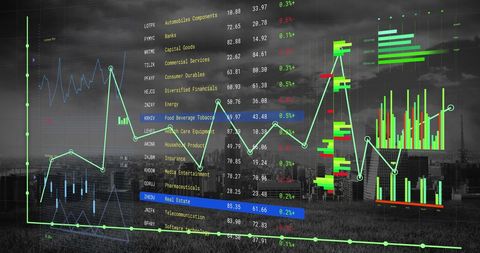
Colorful graphs and data charts depict dynamic stock market trends and analysis. This visual is ideal for financial presentations, global business marketing materials or technology and analytics blogs to highlight trends, data rows, or futuristic digital displays.
Powered by 


downloads
Tags:
More
Credit Photo
If you would like to credit the Photo, here are some ways you can do so
Text Link
photo Link
<span class="text-link">
<span>
<a target="_blank" href=https://pikwizard.com/photo/dynamic-digital-stock-market-data-visualization/7b96e43df9660e5c2d0c427ae5f9ed36/>PikWizard</a>
</span>
</span>
<span class="image-link">
<span
style="margin: 0 0 20px 0; display: inline-block; vertical-align: middle; width: 100%;"
>
<a
target="_blank"
href="https://pikwizard.com/photo/dynamic-digital-stock-market-data-visualization/7b96e43df9660e5c2d0c427ae5f9ed36/"
style="text-decoration: none; font-size: 10px; margin: 0;"
>
<img src="https://pikwizard.com/pw/medium/7b96e43df9660e5c2d0c427ae5f9ed36.jpg" style="margin: 0; width: 100%;" alt="" />
<p style="font-size: 12px; margin: 0;">PikWizard</p>
</a>
</span>
</span>
Free (free of charge)
Free for personal and commercial use.
Author: Creative Art
Similar Free Stock Images

Premium


Premium

Premium


Premium


Premium


Premium


Premium


Premium


Premium


Premium


Premium


Premium


Premium


Premium


Premium


Premium


Premium


Premium


Premium


Premium

Premium


Premium


Premium


Premium


Premium


Explore More Free Stock Images