
- Home >
- Stock Photos >
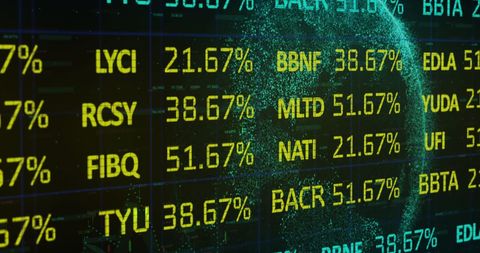
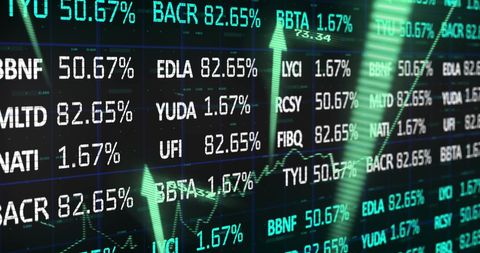
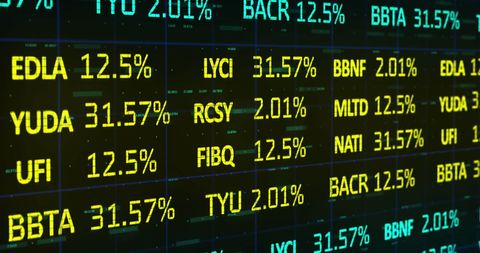
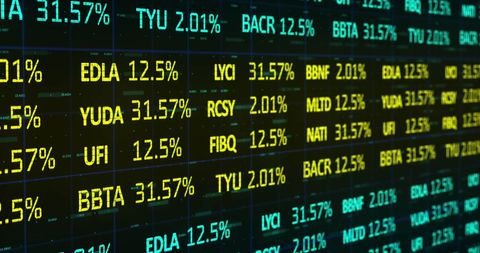
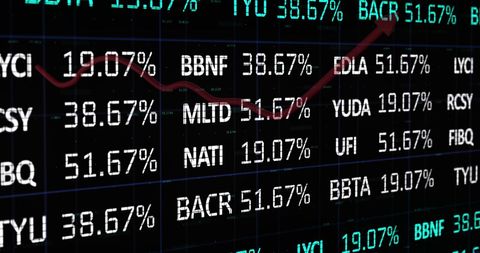
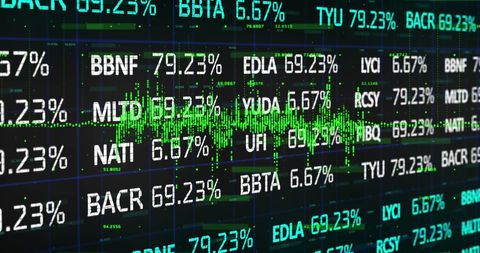
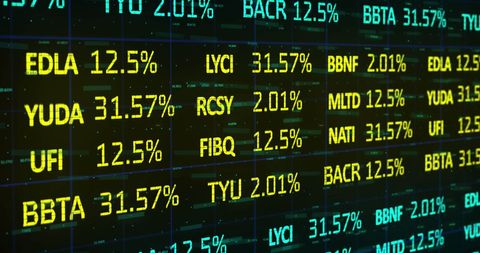
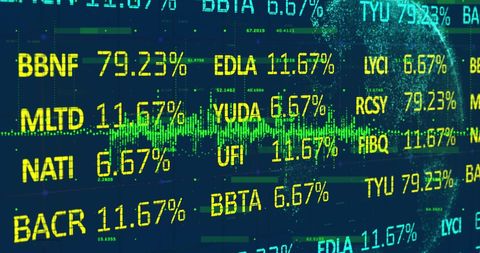
- Dynamic Digital Stock Market Graph Display
Dynamic Digital Stock Market Graph Display Image
Representation of current stock market fluctuations with digital graphs and upward arrows, the image is suitable for financial news articles, investment presentations, economic analytical reports, and digital interfaces in financial technology applications due to its engagement with themes of business trends and financial markets.
Powered by 


downloads
Tags:
More
Credit Photo
If you would like to credit the Photo, here are some ways you can do so
Text Link
photo Link
<span class="text-link">
<span>
<a target="_blank" href=https://pikwizard.com/photo/dynamic-digital-stock-market-graph-display/bcc5aba2307cfe6d1f071cb696cd2e99/>PikWizard</a>
</span>
</span>
<span class="image-link">
<span
style="margin: 0 0 20px 0; display: inline-block; vertical-align: middle; width: 100%;"
>
<a
target="_blank"
href="https://pikwizard.com/photo/dynamic-digital-stock-market-graph-display/bcc5aba2307cfe6d1f071cb696cd2e99/"
style="text-decoration: none; font-size: 10px; margin: 0;"
>
<img src="https://pikwizard.com/pw/medium/bcc5aba2307cfe6d1f071cb696cd2e99.jpg" style="margin: 0; width: 100%;" alt="" />
<p style="font-size: 12px; margin: 0;">PikWizard</p>
</a>
</span>
</span>
Free (free of charge)
Free for personal and commercial use.
Author: Awesome Content
Similar Free Stock Images

Premium


Premium

Premium

Premium

Premium


Premium


Premium


Premium


Premium


Premium


Premium


Premium


Premium


Premium

Premium

Premium

Premium


Premium


Premium


Premium

Premium


Premium


Premium


Premium


Premium

Explore More Free Stock Images