- Home >
- Stock Photos >
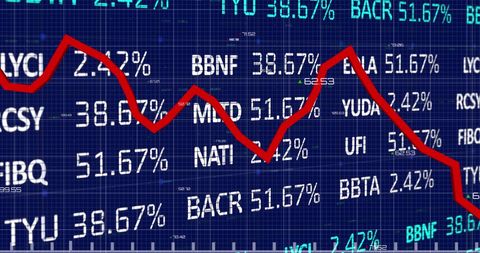
- Dynamic Digital Stock Market Graph with Data Analysis
Dynamic Digital Stock Market Graph with Data Analysis Image

Graphic represents stock market fluctuations with red graph line over digital data grid. Useful for presentations on economic trends, investment strategies, or financial analysis summaries. Ideal for articles on stock market volatility, investing, and data-driven decision making.
Powered by 


2
downloads
downloads
Tags:
More
Credit Photo
If you would like to credit the Photo, here are some ways you can do so
Text Link
photo Link
<span class="text-link">
<span>
<a target="_blank" href=https://pikwizard.com/photo/dynamic-digital-stock-market-graph-with-data-analysis/5dd86f15a1ce821bac919d77a4bf162c/>PikWizard</a>
</span>
</span>
<span class="image-link">
<span
style="margin: 0 0 20px 0; display: inline-block; vertical-align: middle; width: 100%;"
>
<a
target="_blank"
href="https://pikwizard.com/photo/dynamic-digital-stock-market-graph-with-data-analysis/5dd86f15a1ce821bac919d77a4bf162c/"
style="text-decoration: none; font-size: 10px; margin: 0;"
>
<img src="https://pikwizard.com/pw/medium/5dd86f15a1ce821bac919d77a4bf162c.jpg" style="margin: 0; width: 100%;" alt="" />
<p style="font-size: 12px; margin: 0;">PikWizard</p>
</a>
</span>
</span>
Free (free of charge)
Free for personal and commercial use.
Author: Authentic Images
Similar Free Stock Images
Loading...


Premium


Premium


Premium


Premium


Premium


Premium


Premium


Premium


Premium


Premium


Premium


Premium

Premium


Premium


Premium


Premium


Premium


Premium


Premium


Premium

Premium


Premium


Premium


Premium


Premium