1. Home > 
  2. Stock Photos > 
  3. Dynamic Display of Real-Time Data and Digital Analytics

Dynamic Display of Real-Time Data and Digital Analytics Image

Dynamic Display of Real-Time Data and Digital Analytics

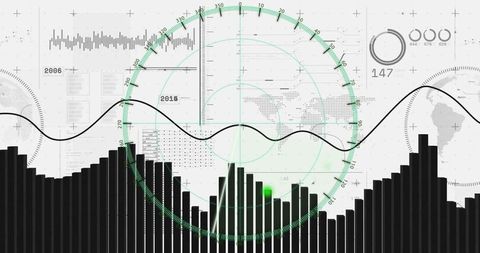
Abstract display of changing numbers and graphs representing digital analytics and financial data analysis. Useful for illustrating articles about finance, technology, data-driven businesses, or futuristic data presentation.

Powered by Shutterstock logo - Get 15% off with code: PIKWIZARD15
Internet cyberspace data information collection analytical statistics computer storage ai artificial intelligence calculation, blue background banner copyspace. - Powered by Shutterstock - Get 15% off with code: PIKWIZARD15Businessman using KPI dashboard.Financial business KPI System data analytics graph dashboard.Data System KPI and metrics connected in database for follow earnings,operations and sales data. - Powered by Shutterstock - Get 15% off with code: PIKWIZARD15Software, coding hologram and woman in data analytics, information technology and gdpr overlay. Programmer or IT person in glasses reading script, programming and cybersecurity research on computer - Powered by Shutterstock - Get 15% off with code: PIKWIZARD15Online trading, Investment, Strategy market plan, and Stock mark - Powered by Shutterstock - Get 15% off with code: PIKWIZARD15Stock market or forex trading graph on touchscreen,  finance and investment concept. Economy trends for business, financial charts and digits. - Powered by Shutterstock - Get 15% off with code: PIKWIZARD15

Credit Photo

If you would like to credit the Photo, here are some ways you can do so

Free (free of charge)

Free for personal and commercial use.

Author: Creative Art

Similar Free Stock Images

Digital Visualization of Financial and Statistical Data
Premium
Software, coding hologram and woman on tablet thinking of data analytics, digital technology and night overlay. Programmer or IT person in glasses on 3d screen, programming and cybersecurity research
Abstract Financial Data Illustration with Graphs and Global Elements
Digital Financial Data Representation with Abstract Graph
Abstract Financial Data Technology Background
Dynamic Digital Financial Data Interface Background
Premium
A hand interacts with futuristic virtual data screens displaying analytics and charts on a dark background.
Cybersecurity Shield Protecting Digital Financial Data
Futuristic Digital Data Analysis Visual with Line Graphs
Abstract Data Visualization with Graphs and Networks
Global Data Visualization Over Evening City Skyline
Premium
Analyst working in Business Analytics and Data Management System to make report with KPI and metrics connected to database. Corporate strategy for finance, operations, sales, marketing.
Digital Financial Data Analysis Over Modern Server Center
Abstract Financial Graph and Data Analysis Background
Candlestick Chart with Moving Averages on Dark Background
Digital Data Processing Background with Dynamic Lines
Premium
Professional Using AI-Powered Laptop and Smartphone to Analyze Data Insights and Marketing Analytics with Holographic Graphs and Infographics, Showcasing Advanced Technology and Future Digital
Abstract Financial Data Chart Over Urban Skyline
Digital Analysis of Financial Data with Dynamic Graphs
Abstract Financial Charts with Colorful Holographic Effects
Financial Analytics with Chart and Graph Overlay on Digital Background
Premium
Intelligence (BI) and business analytics (BA) with key performance indicators (KPI) dashboard concept.StartUp Programming Team. Website designer working digital tablet dock keyboard.
Abstract Mathematics with Dynamic Graph Line Pattern
Abstract Financial Data and Charts in Urban City Background
Global Data Processing with Abstract Graph and Network
Abstract Digital Data Stream with Graphical Analytics
Premium
Professional analyzing financial data graphs, charts on laptop display at a modern workspace. Financial analysis or business evaluation concept
Abstract Blue Data Visualization with Line Graph and Digital Interface Elements
Digital Dashboard with Graphs and Interactive Elements
Futuristic Financial Charts Over Night Urban Skyline
Futuristic Digital Analytics Interface With Data Visualization
Financial Data Analysis with Bar and Line Graphs
Global Financial Data Interaction and Digital Analytics
Premium
Data flow from database and cloud to processing and analytics dashboards, representing data analysis, automation, insight generation, and digital intelligence Latch
Digital Financial Graph and Data Display on Blue Background
Digital Charts and Financial Data Background in Blue Tones
Analyzing Financial Downtrend with Digital Data Concepts
Futuristic Digital Financial Data Analytics with Graphs
Premium
analyst manages the system database, and analysis data plans, and reports. shows a dashboard chart on the computer. research on platform digital technology. analytics business concept
Abstract Data Graph Infographic on Purple Gradient Background
Data Processing Visualization with Cityscape Background
Financial Data Analytics in Digital Interface Design
Data Analytics Visualization with Graphs and Charts
Premium
Data analyst working on business analytics dashboard with charts, metrics and KPI to analyze performance and create insight reports for operations management.
Abstract Financial Data Graph with Stock Market Trends
Data Analytics Graphs on Blue Digital Background
Infinity Symbol Overlay with Stock Market Graphs and Trade Data
Abstract Financial Market Analysis with Candlestick and Bar Charts
Premium
Big Data Technology for Business Finance Analytic Concept. Modern graphic interface shows massive information of business sale report, profit chart and stock market trends analysis on screen monitor.
Digital Financial Data and Multicurrency Exchange Charts
Animated Financial Chart Depicting Stock Market Trends
Digital Data Analytics with Financial Graphs and Indigo Background
Colorful Financial Graph with Digital Technology Concept
Premium
Business intelligence technology and big data analytic mixed media showing concept of futuristic information report using computer software to analyze strategic investment advice for decision making .
Digital Finance Data and Statistical Graphs on Dark Background
Futuristic Financial Data Chart with Virtual Interface
Digital Data Analysis with Stock Market Visualization
Financial Data Processing with Molecular Overlay in a Digital Interface
Premium
Data and AI Powering Global Analytics: Visualize data-driven insights with AI and big data, showcasing global networks, large language models, artificial neural network and digital transformation.
Digital Financial Trading Dashboard with Data Visualization
Futuristic Cybersecurity Terminal with Code and Graphs
Digital Analytics Display with Candlestick Graph and User Engagement
Digital Financial Graphs and Charts on Dark Background
Digital Data Visualization in Global Business Context
Global Financial Data and Analytics Concept with Rising Arrow
Premium
Analyst Works on Personal Computer Showing business analytics dashboard with charts, metrics and KPI to analyze performance and create insight reports for operations management. Data analysis concept.
Dynamic Financial Data Analytics Interface with Blue Background
Business Chart with Declining Graph and Red Arrow
Abstract Financial Data Analysis with Graphs and Trends
Abstract Digital Statistical Data Analysis Backdrop
Premium
Data science and big data technology. Scientist computing, analysing and visualizing complex data set on computer. Data mining, artificial intelligence, machine learning, business analytics.
Data Processing and Analytics Over Cityscape at Night
Digital Financial Analytics with Zero Percent Concept
Abstract Data Visualization with Pie Charts and Graphs
Financial Data Analysis Overlaying Server Room
Premium
Lines and dots flying away from the center on a blue background to illustrate the information network, artificial intelligence, big data, and neural connections. Copy space
Financial Data Charts and Graphs on Digital Interface
Financial Data and Graphs on Digital Blue Background
Financial Data Processing with Graphs and Charts
Visualizing Financial Data Trends Over Urban Backdrop
Premium
Skyscrapers with superimposed financial charts, symbolizing real estate market trends on a cloudy sky background, concept of market analysis
Data Analytics with Stylized Blue Graph Lines Visual
Colorful Graphical Data Analysis in Abstract Background
Financial Data Displayed with Trends on Blue Background
Modern Finance Analytics with Digital Charts and Data
Premium
Cloud Computing Digital Information Data Center Technology. Computer Information Storage. Cybersecurity 3d Illustration
Futuristic Data Patterns with Global Connections
Digital Chart Overlays in Empty Office Space
Digital Financial Data Analysis with Global Technological Interface
Dynamic Stock Market Graph with Fluctuating Data Bars
Premium
Data analytics automated with AI technology. Businessman use laptop and dashboard for Automating Data Management Analytics and Business Reports with KPI. AI chat bot. Database. Sales. Marketing.
Futuristic Data Visualization With Bar Chart and Line Graph
Monochrome Dashboard with Vertical Bar Chart, Wave Trend Line and Green Radar Dot
Global Financial Data Visualization with Charts and Graphs
Digital Financial Data Analysis with Global Connections Theme
Financial Data and Risk Management Analysis in Global Context
Digital Stock Market Pulse with Numbers on Blue Background
Premium
An analyst uses a computer and dashboard for data business analysis and Data Management System with KPI and metrics connected to the database for technology finance, operations, sales, marketing
Declining Financial Forecast with Digital Interface
Abstract Financial Data and Global Analysis Graphics
Abstract Digital Financial Chart on Blue Interface
Abstract Data Processing and Analysis on White Background
Premium
Business finance data analytics graph chart report, man using laptop computer hand typing investment data digital marketing KPI sale report, financial management technology, cyber space metaverse.
Abstract Data Processing and Analytics Concept
Financial Data Analysis Overlaid on Digital Background
Abstract Financial Charts in Futuristic Design
Digital Stock Market Data Over Cityscape Concept
Premium
African Businesswoman Using Analytics Data KPI Dashboard Tech
Financial Data Visualization with Line and Bar Graphs
Digital Financial Graph and City Silhouette Backdrop
Financial Data Processing Over Digital Cityscape
Animated Financial Data with Heartbeat Overlapping Lines
Premium
Black woman with tablet, erp overlay and charts, innovation in research and programming for future app technology. Futuristic network, analytics and developer for startup business website IT software
Dynamic Forex Market Chart with Multiple Currencies and Growth Trends
Dynamic Visualization of Financial Data and Analysis
Data Processing Visualization with Digital Charts on Blue Background
Financial Data Analytics Overlaid on Modern Server Room
Premium
Concentrated young African American businesswoman employee worker in eyeglasses analyzing online sales statistics data on computer, reviewing marketing research, working with documents at home office.
Futuristic Financial Data and Cityscape Overlay
Abstract Financial Data Charts with Analytics and Trends
Financial Data Analysis Graph on Blue Background Concept
Analytics Dashboard with Dynamic Financial Data Visualization
Premium
Smiling mature businessman holding smartphone sitting in office. Middle aged manager ceo using cell phone mobile apps and laptop. Digital technology applications and solutions for business development
Analyzing Collaborative Team Reviewing Augmented Reality Data Dashboards and Graphs