
- Home >
- Stock Photos >
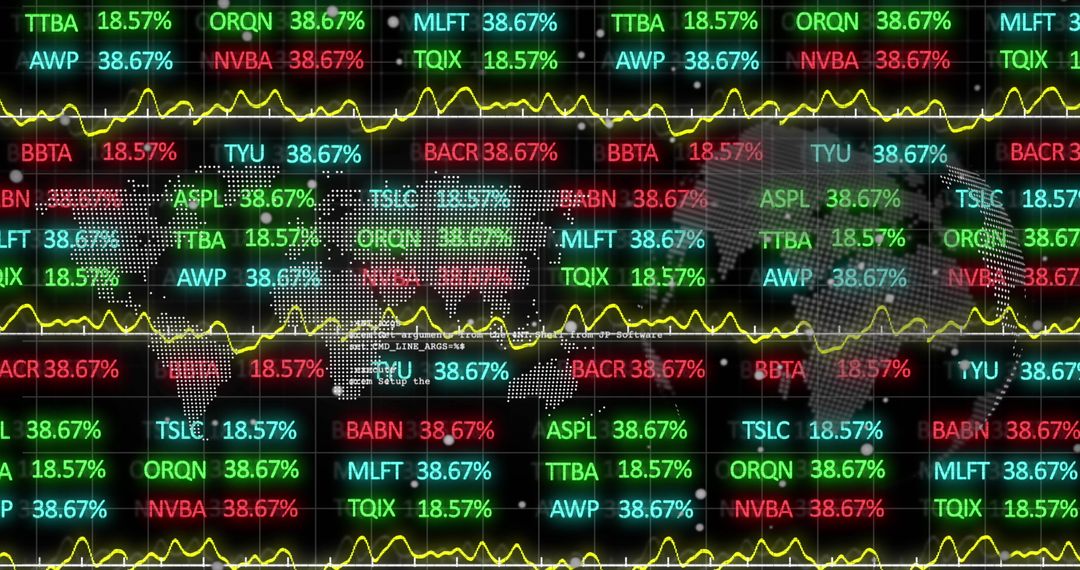
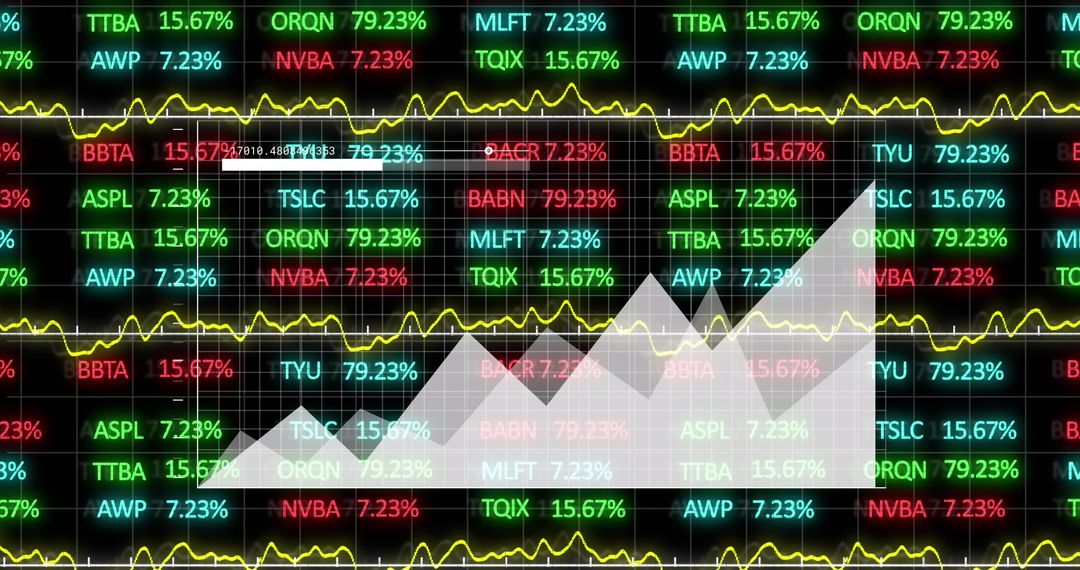
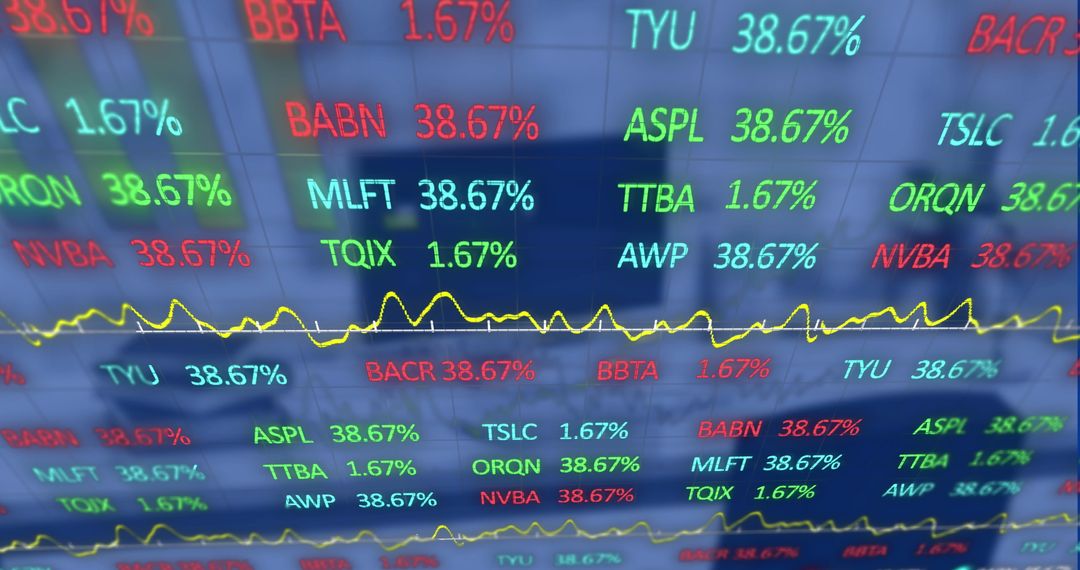
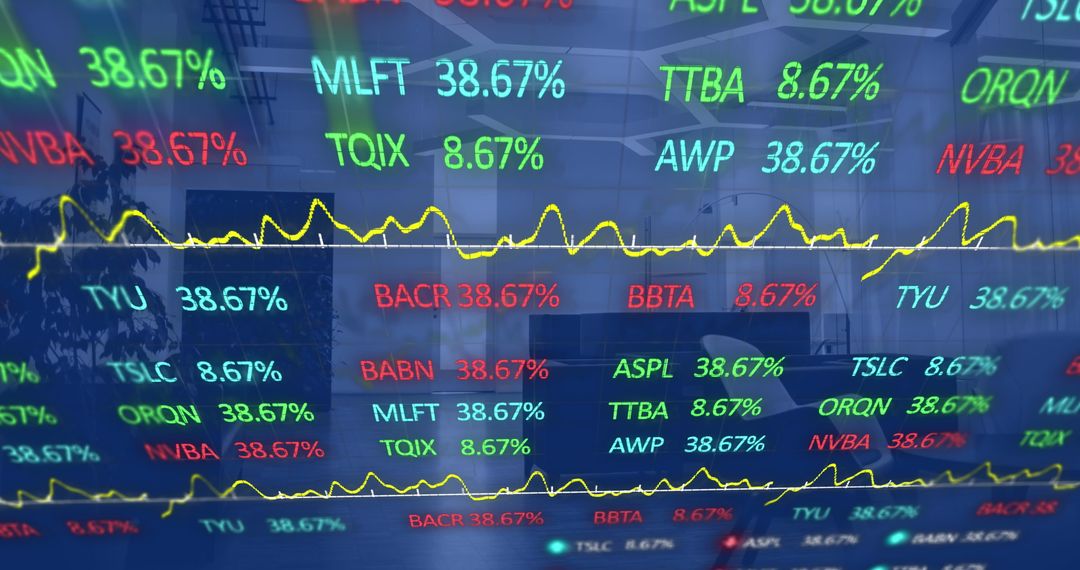
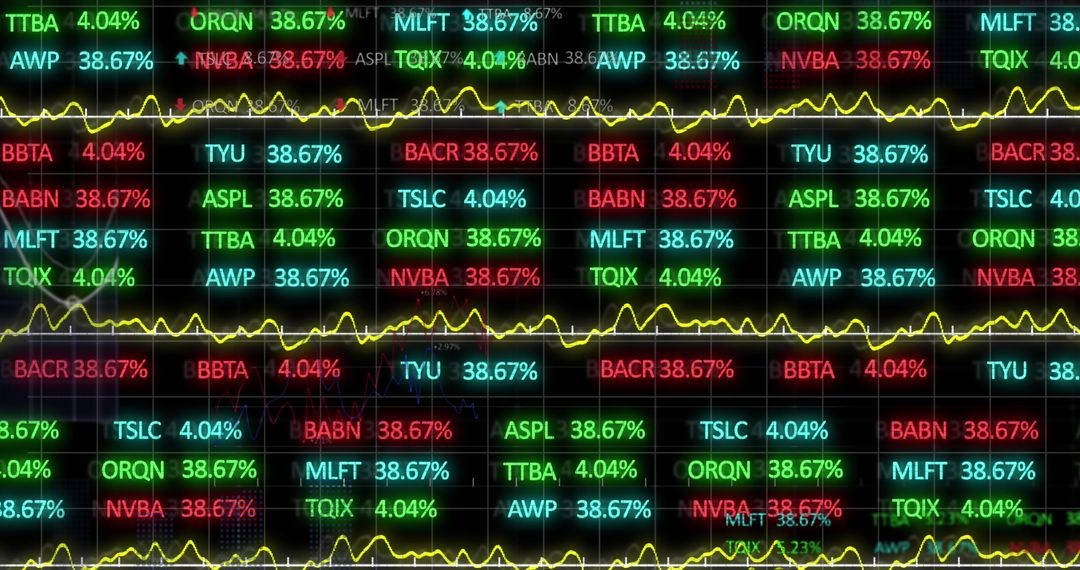
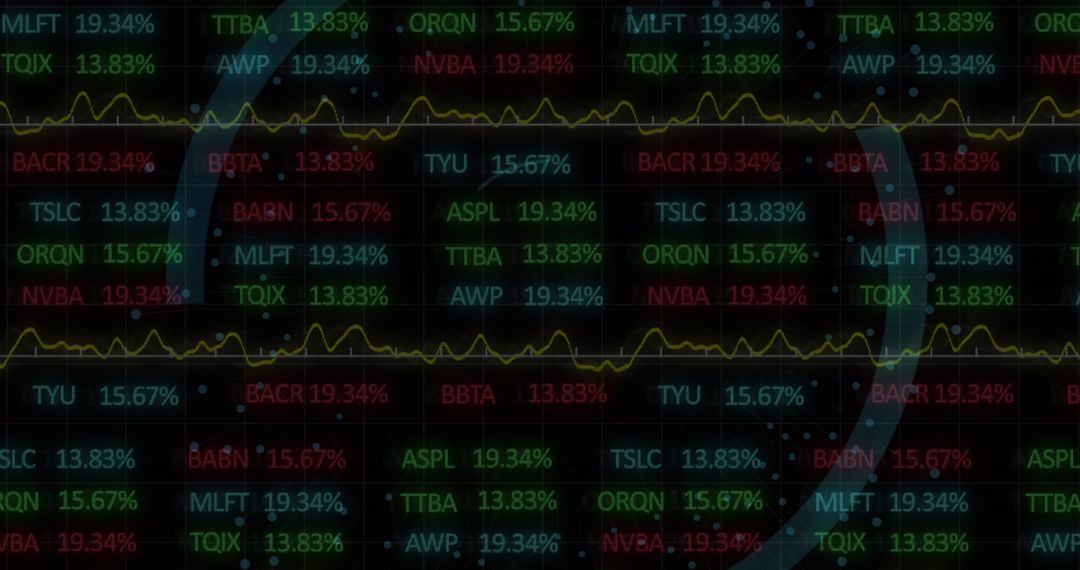
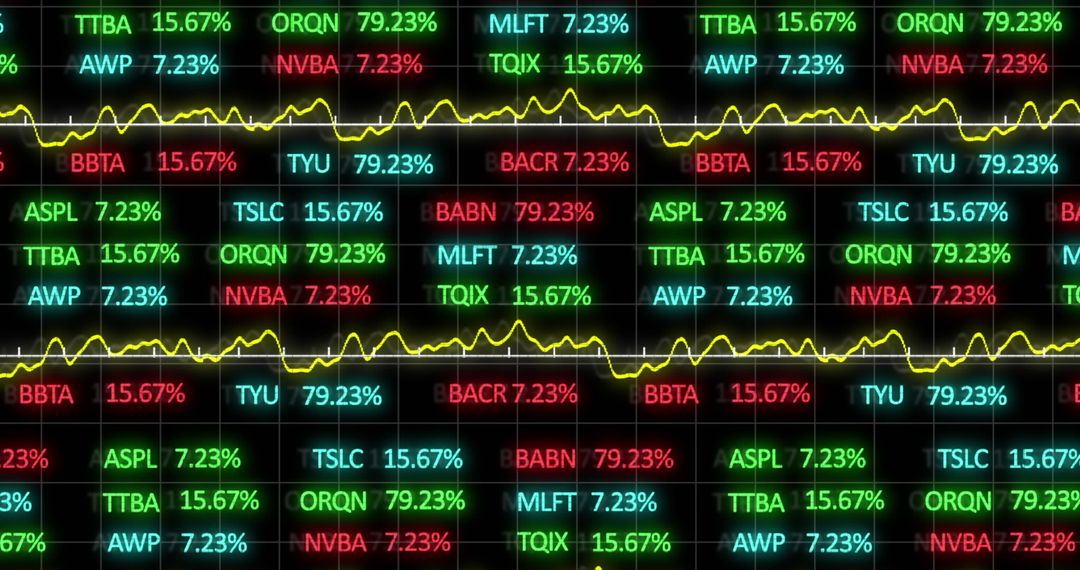
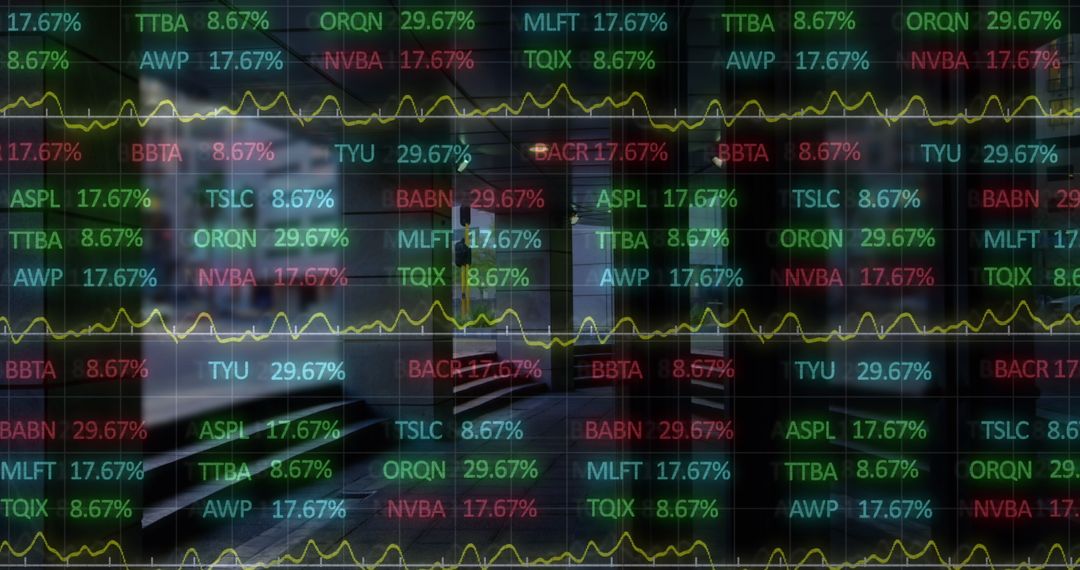
- Dynamic Display of Stock Market Data and Fluctuating Graphs
Dynamic Display of Stock Market Data and Fluctuating Graphs Image

Digital display of fluctuating stock values and vibrant line graphs represent fast-paced changes in financial markets. Perfect for use in articles about investment trends, economy, or financial education materials. Ideal for conveying movement and complexity of global financial systems.
Powered by  - Get 15% off with code: PIKWIZARD15


4
downloads
downloads
Tags:
More
Credit Photo
If you would like to credit the Photo, here are some ways you can do so
Text Link
photo Link
<span class="text-link">
<span>
<a target="_blank" href=https://pikwizard.com/photo/dynamic-display-of-stock-market-data-and-fluctuating-graphs/985fb513ef818815bf211b71b52c6ab7/>PikWizard</a>
</span>
</span>
<span class="image-link">
<span
style="margin: 0 0 20px 0; display: inline-block; vertical-align: middle; width: 100%;"
>
<a
target="_blank"
href="https://pikwizard.com/photo/dynamic-display-of-stock-market-data-and-fluctuating-graphs/985fb513ef818815bf211b71b52c6ab7/"
style="text-decoration: none; font-size: 10px; margin: 0;"
>
<img src="https://pikwizard.com/pw/medium/985fb513ef818815bf211b71b52c6ab7.jpg" style="margin: 0; width: 100%;" alt="" />
<p style="font-size: 12px; margin: 0;">PikWizard</p>
</a>
</span>
</span>
Free (free of charge)
Free for personal and commercial use.
Author: Awesome Content
Similar Free Stock Images

Premium


Premium


Premium


Premium


Premium


Premium


Premium


Premium


Premium


Premium


Premium


Premium


Premium


Premium


Premium


Premium


Premium


Premium


Premium


Premium


Premium


Premium


Premium


Premium

