- Home >
- Stock Photos >
- Dynamic Display of Stock Market Data with Graph Lines
Dynamic Display of Stock Market Data with Graph Lines Image

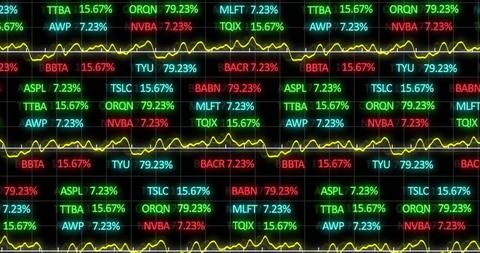
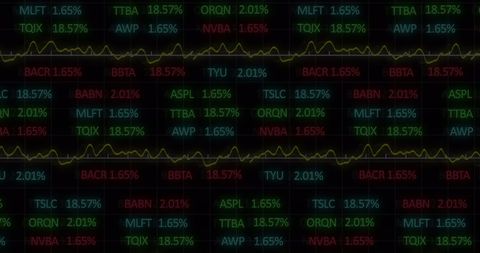
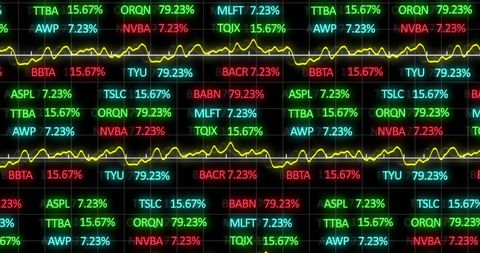
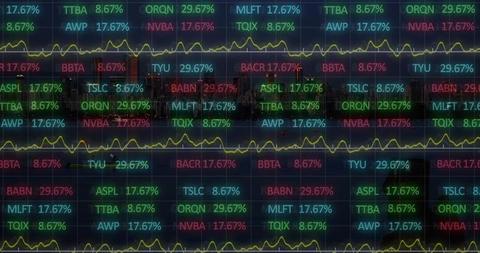
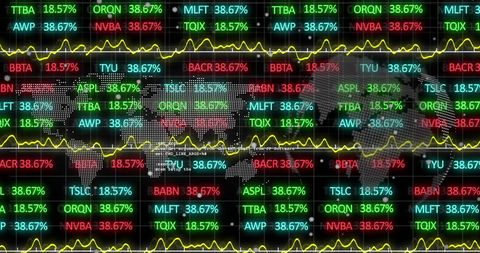
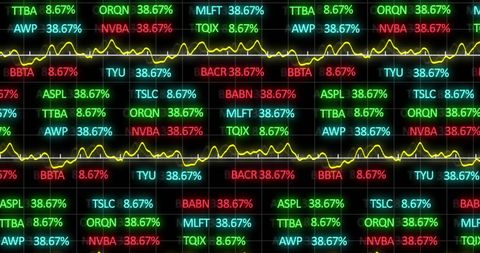
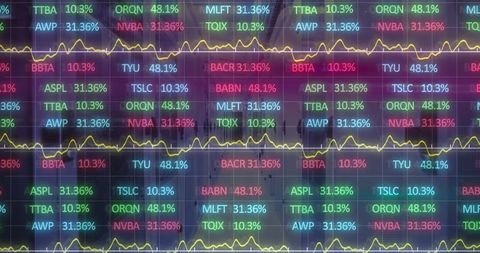
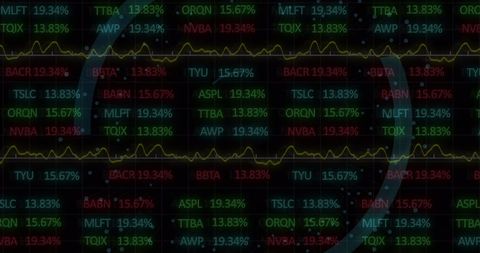
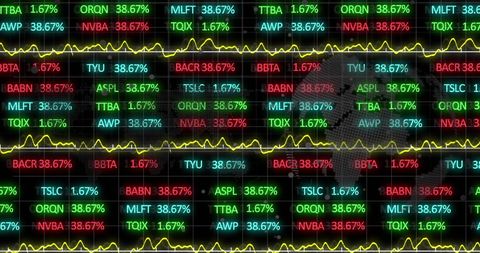
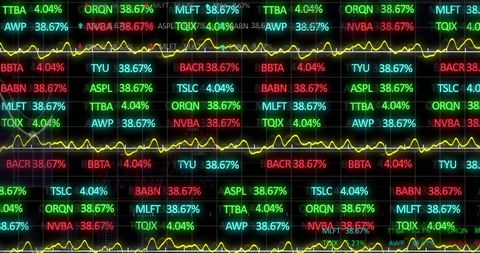
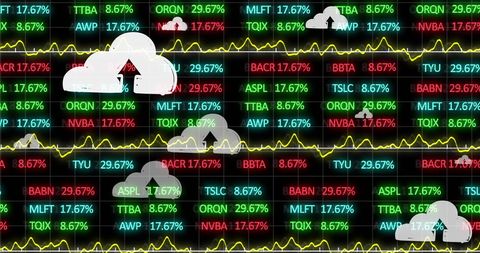
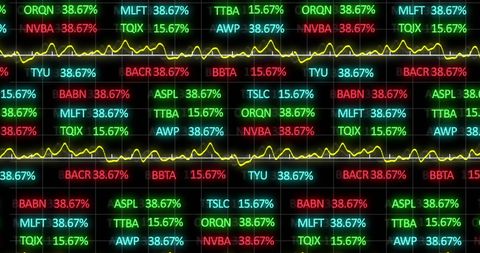
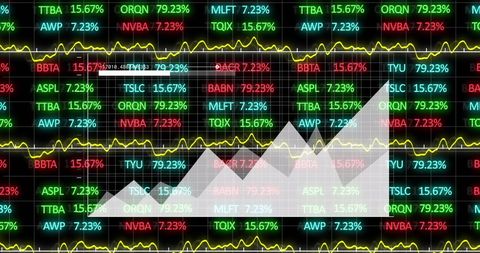
This visually striking depiction of stock market data features fluctuating graph lines on a digital screen, representing financial data complexities. With tickers, numbers, and current trends prominent, this graphic is ideal for use in financial analysis platforms, investment presentation materials, or economic growth reports. It conveys a sense of real-time data processing in a globally connected market environment.
Powered by  - Get 15% off with code: PIKWIZARD15


downloads
Tags:
More
Credit Photo
If you would like to credit the Photo, here are some ways you can do so
Text Link
photo Link
<span class="text-link">
<span>
<a target="_blank" href=https://pikwizard.com/photo/dynamic-display-of-stock-market-data-with-graph-lines/437378d8a8d7e1ea9156de68067ba8db/>PikWizard</a>
</span>
</span>
<span class="image-link">
<span
style="margin: 0 0 20px 0; display: inline-block; vertical-align: middle; width: 100%;"
>
<a
target="_blank"
href="https://pikwizard.com/photo/dynamic-display-of-stock-market-data-with-graph-lines/437378d8a8d7e1ea9156de68067ba8db/"
style="text-decoration: none; font-size: 10px; margin: 0;"
>
<img src="https://pikwizard.com/pw/medium/437378d8a8d7e1ea9156de68067ba8db.jpg" style="margin: 0; width: 100%;" alt="" />
<p style="font-size: 12px; margin: 0;">PikWizard</p>
</a>
</span>
</span>
Free (free of charge)
Free for personal and commercial use.
Author: Authentic Images
Similar Free Stock Images
Loading...

Premium


Premium


Premium

Premium


Premium

Premium


Premium

Premium


Premium


Premium


Premium


Premium


Premium

Premium


Premium


Premium


Premium


Premium

Premium


Premium

Premium


Premium


Premium


Premium


Premium