- Home >
- Stock Photos >
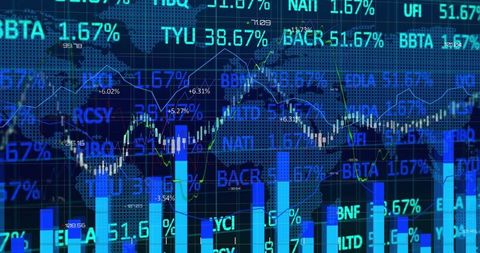
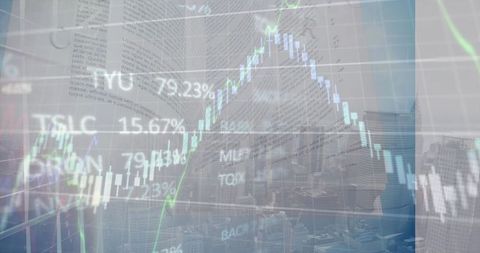
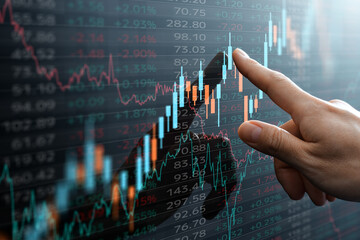
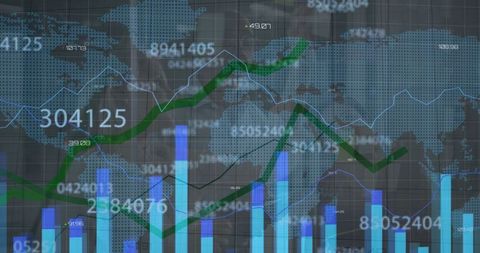
- Dynamic Finance Double Exposure with Graphs and Data Interfaces
Dynamic Finance Double Exposure with Graphs and Data Interfaces Image

Image shows a dynamic overlay of candlestick charts, bar graphs, and numeric data contrasted with a visible trading interface background. Ideal for visualizing complex financial analytics and digital asset management themes. Perfect for online investment gallery, finance technology applications, or informative presentations in economic seminars focusing on trading strategies and growth forecasting.
Powered by 


downloads
Tags:
More
Credit Photo
If you would like to credit the Photo, here are some ways you can do so
Text Link
photo Link
<span class="text-link">
<span>
<a target="_blank" href=https://pikwizard.com/photo/dynamic-finance-double-exposure-with-graphs-and-data-interfaces/2d716fba38a168f5b4942acd1697bc1d/>PikWizard</a>
</span>
</span>
<span class="image-link">
<span
style="margin: 0 0 20px 0; display: inline-block; vertical-align: middle; width: 100%;"
>
<a
target="_blank"
href="https://pikwizard.com/photo/dynamic-finance-double-exposure-with-graphs-and-data-interfaces/2d716fba38a168f5b4942acd1697bc1d/"
style="text-decoration: none; font-size: 10px; margin: 0;"
>
<img src="https://pikwizard.com/pw/medium/2d716fba38a168f5b4942acd1697bc1d.jpg" style="margin: 0; width: 100%;" alt="" />
<p style="font-size: 12px; margin: 0;">PikWizard</p>
</a>
</span>
</span>
Free (free of charge)
Free for personal and commercial use.
Author: Authentic Images
Similar Free Stock Images
Loading...

Premium


Premium


Premium


Premium

Premium


Premium


Premium


Premium

Premium


Premium


Premium


Premium


Premium


Premium
Premium

Premium


Premium


Premium


Premium


Premium


Premium


Premium

Premium

Premium

Premium