- Home >
- Stock Photos >
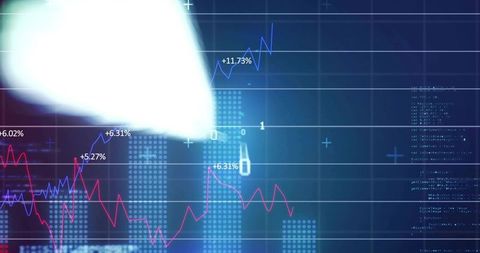
- Dynamic Financial Analysis and Data Processing Display
Dynamic Financial Analysis and Data Processing Display Image

This visually engaging composition merges financial data with chemical structures, highlighting themes of global finance and advanced data processing. The intense hue and dynamic lines add a futuristic view to financial and technological sectors. Use it in contexts illustrating financial technology, business strategy presentations, or as part of a visual toolkit promoting modern economic and scientific innovation.

downloads
Tags:
More
Credit Photo
If you would like to credit the Photo, here are some ways you can do so
Text Link
photo Link
<span class="text-link">
<span>
<a target="_blank" href=https://pikwizard.com/photo/dynamic-financial-analysis-and-data-processing-display/82fb5eaa6a8eae67a251bf96a154ab5f/>PikWizard</a>
</span>
</span>
<span class="image-link">
<span
style="margin: 0 0 20px 0; display: inline-block; vertical-align: middle; width: 100%;"
>
<a
target="_blank"
href="https://pikwizard.com/photo/dynamic-financial-analysis-and-data-processing-display/82fb5eaa6a8eae67a251bf96a154ab5f/"
style="text-decoration: none; font-size: 10px; margin: 0;"
>
<img src="https://pikwizard.com/pw/medium/82fb5eaa6a8eae67a251bf96a154ab5f.jpg" style="margin: 0; width: 100%;" alt="" />
<p style="font-size: 12px; margin: 0;">PikWizard</p>
</a>
</span>
</span>
Free (free of charge)
Free for personal and commercial use.
Author: Creative Art